Last March, we told readers that they need to “sit down” for what we are about to show: a chart showing the indexed “analog” performance of the S&P since the election of presidents JFK and Donald Trump. What the chart showed, is that as of March 15, 2018 the “analog” was only three bps apart on Day 338 after election day, or just a one S&P500 point difference.
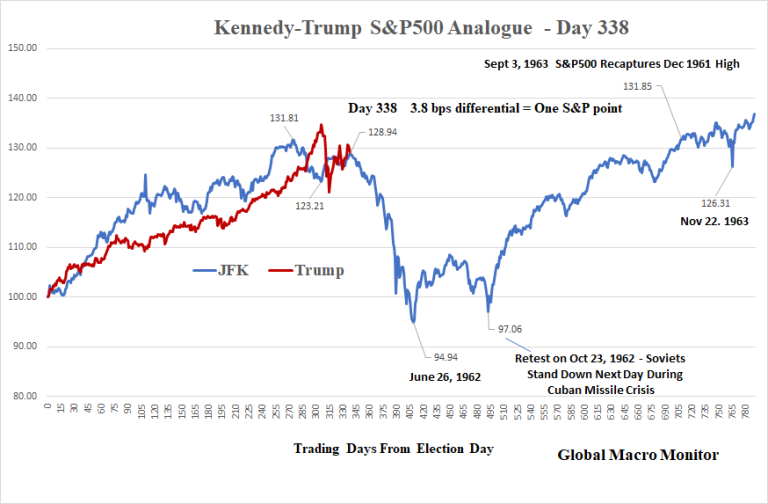
Commenting on the chart above, we said that it was “now make or break time for the analog”, adding that “if it is a true tracker, the S&P500 should rollover hard” soon.
In retrospect it took a little longer, but the S&P indeed resumed tracked the “JFK” analog almost tick for tick, to the point where Goldman chief equity strategist David Kostin overnight pointed out the uncanny resemblance of the (indexed) S&P under Trump vs under JFK.
What the chart below shows is that the current near-bear market is virtually identical to the “Kennedy Slide” of 1962, which like now, was driven by policy concerns and culminated with the Cuban missile crisis and bottomed on October 23, 1962 when the Soviets stood down and a potential hot (very hot) war was averted.
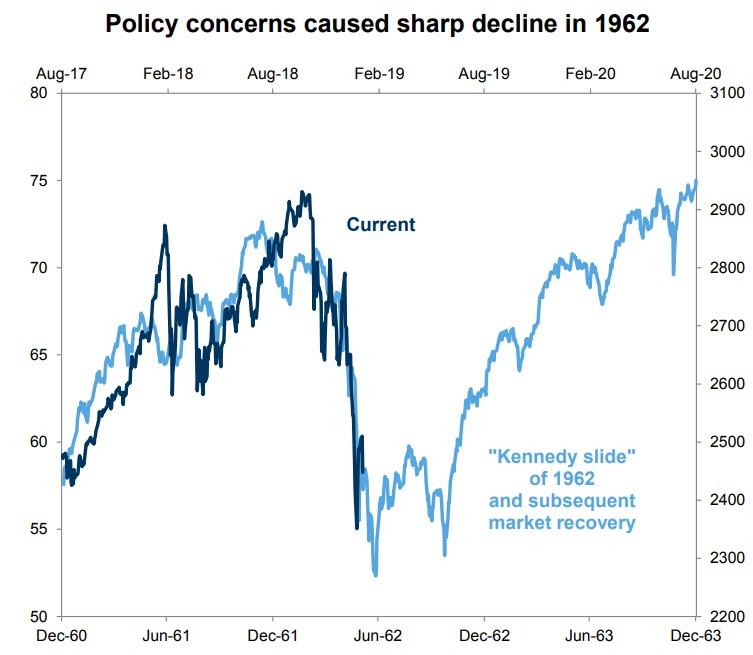
If indeed we are reliving some bizarro JFK world, the chart above suggests that there is further downside to the S&P, which will drop as low as 2,300 before stabilizing and eventually rebounding. Goldman – which is bullish on the market in 2019 – shows this analog as an example of what happens to the market following a fast drawdown, whether the one seen in 1962 or late 2018, namely that most such sharp drops tend to be followed by just as sharp rebounds.
Goldman’s Kostin then makes the case that virtually all prior sharp bear market drawdowns have been buying opportunities…

… with one big footnote: the drawdown has to take place without a broader economic recession, as otherwise the average S&P performance (during recession bear markets) continues to slide some 18 months after the market’s peak, in the current case, the S&P’s all time high hit on Sept 20, 2018.
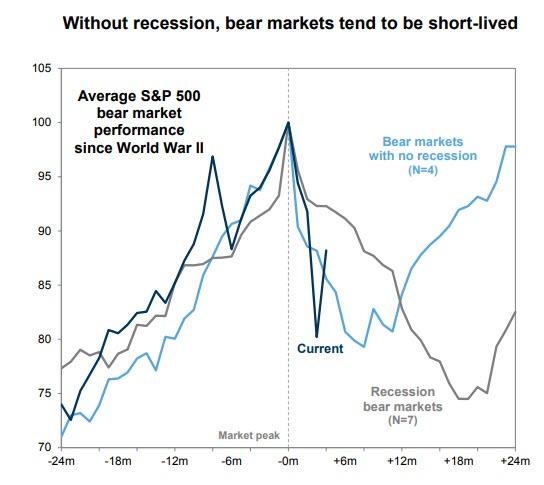
The question, then, is whether the current bear market is taking place in a recession, one which at least for now has not been observed in the economic data, or it is just a technical drop in the market, one which is expected to normalize relatively fast.
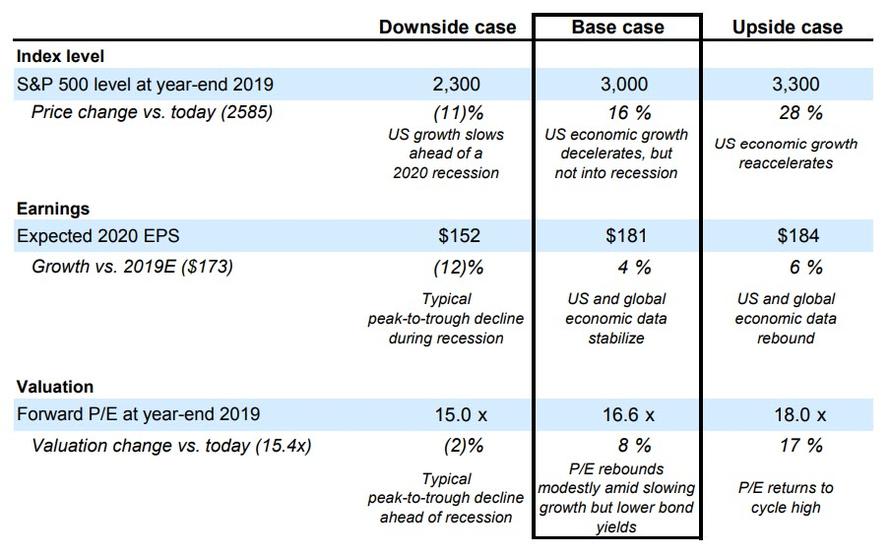
For its part, Goldman remains convinced that stocks are poised for substantial gains in 2019. As shown below, Kostin has a “base case’ price target of 3,000 for the S&P at the end of the year, however he also lays out an Upside Case, in which the S&P rises 28% from Friday’s close to 3,300 as “US economic growth reaccelerates”, and a Downside Case, where the S&P drops a further 11% to 2,300 as “US growth slows ahead of a 2020 recession.”
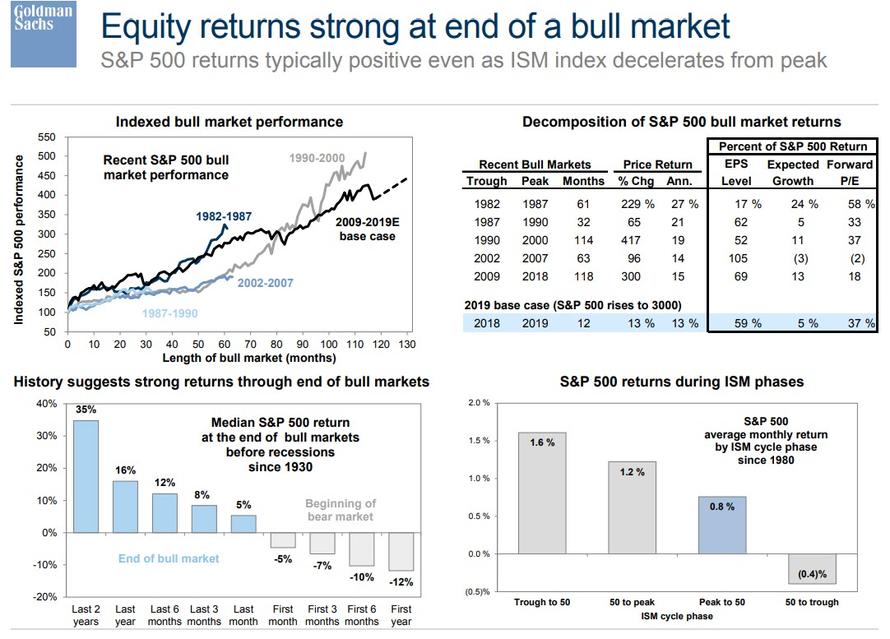
Finally, Goldman makes one more key point: even though we are very late in the current cycle, something which nobody contends, equity returns at the end of a bull market tend to be strongest which means that all those professional money managers who go to cash now stand to lose the most from the “last push” higher in markets observed historically just before the market peaks one last time and he rug is pulled out from under it.
via RSS http://bit.ly/2Foi2cf Tyler Durden