Via Pervalle,
Below is a piece we put together about a month ago that was sent around to our network. Given recent market action and the thesis still largely playing out, we decided to share it, which we are likely to do more of in the future. If you like the work below, feel free to subscribe to our mailing list at the bottom of the page.
* * *
The probabilities of US rates falling materially over the next six to eight months are the highest of the cycle. While global equities and commodities have begun to price in slowing growth, US rates are marginally off the highs – with the 10-year trading at 3.06%. The disconnect is likely due to supply and demand worries surrounding the Fed’s balance sheet run off, expanding US fiscal deficits, and the lack of demand from European and Japanese investors as hedged yields turn negative.
We see these concerns being largely priced into the market; however, the following line items seem they are not:
-
China will continue to pressure the global economy, with no real signs of stimulus coming through the system until the back half of 2019 under the assumption they will be able to expand credit at similar historical rates
-
The US economy will slow materially due to crude oil pulling down industrial production, as well as higher interest rates weighing on the consumer and US housing
-
US and Global Excess liquidity will drag equities lower, resulting in a bid for bonds
-
The Federal Reserve will likely get cold feet and backtrack as they recognize the economy is slowing
-
CTA and momentum players should continue to cover their shorts, in turn flipping momentum positive
-
Technically, US bonds are bottoming and have very favorable risk reward profiles over the following months
Given the above, we assign an 84% probability to 10 year rates falling to 2.3% from 3.06% over the next 6-8 months, before pausing and ultimately moving lower if our thesis is correct. Below we outline this thesis and seek to disprove the current bear argument.
WHAT THE MARKETS ARE SAYING
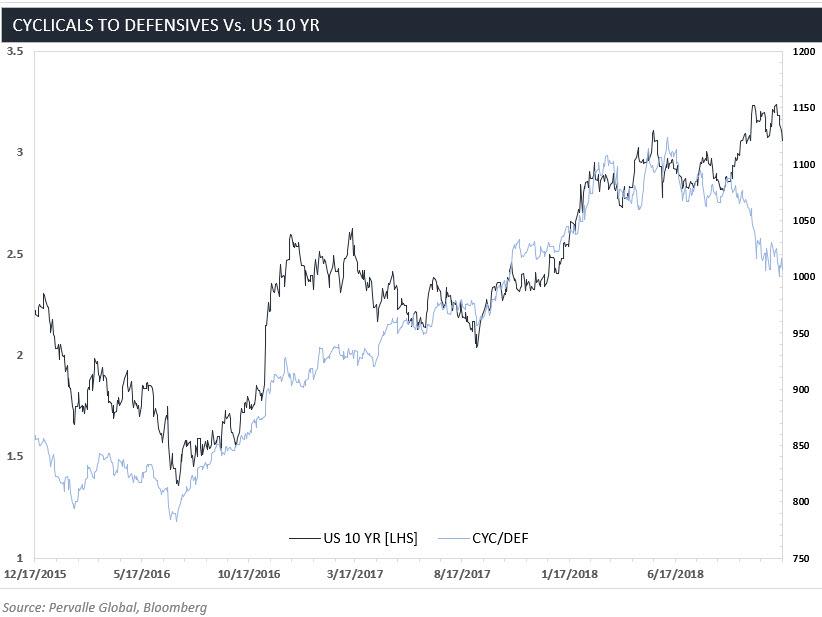
A large part of our process is relying on factions of the market to give us a pulse of the global economy, as well as our thesis. Currently, many of these market groups and ratios are indicating that rates should be materially lower. We can see this domestically via US leadership, as defensive sectors like utilities and staples have been out performing cyclicals such as financials and industrials. This ratio has historically been highly correlated to US rates and is currently indicating the US 10 year should trade closer to 2.3%, as shown below.
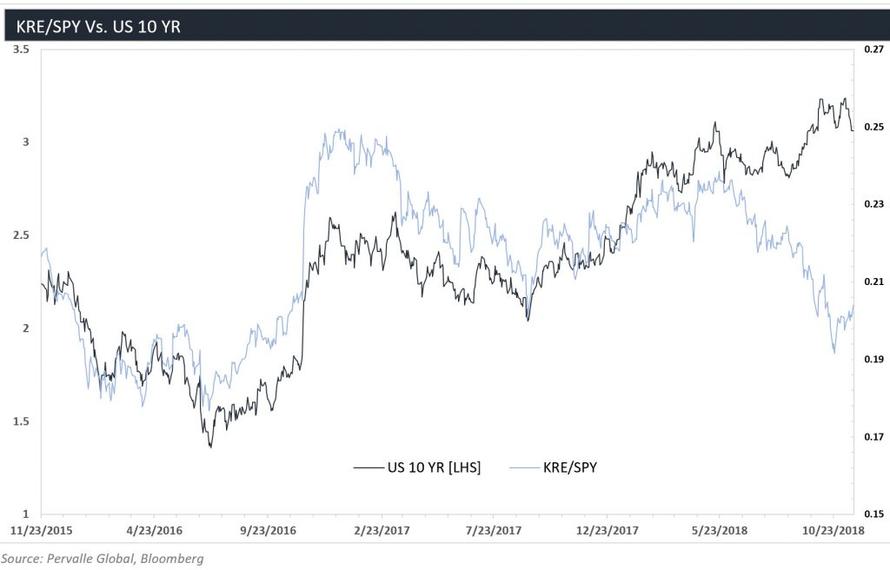
Regional banks (KRE) are also providing the same indication, as KRE/SPY puts the US 10 year closer to 2.2%.
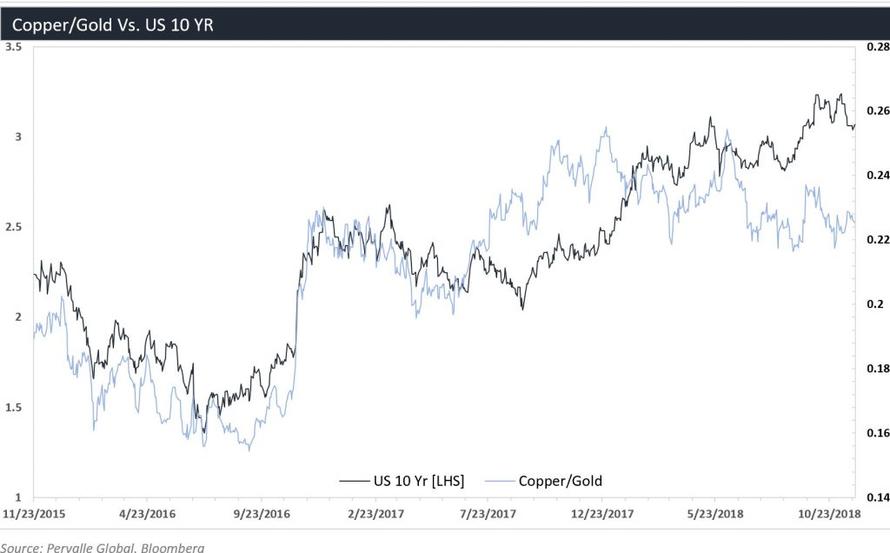
Copper to gold says something similar, with rates around 2.4%.
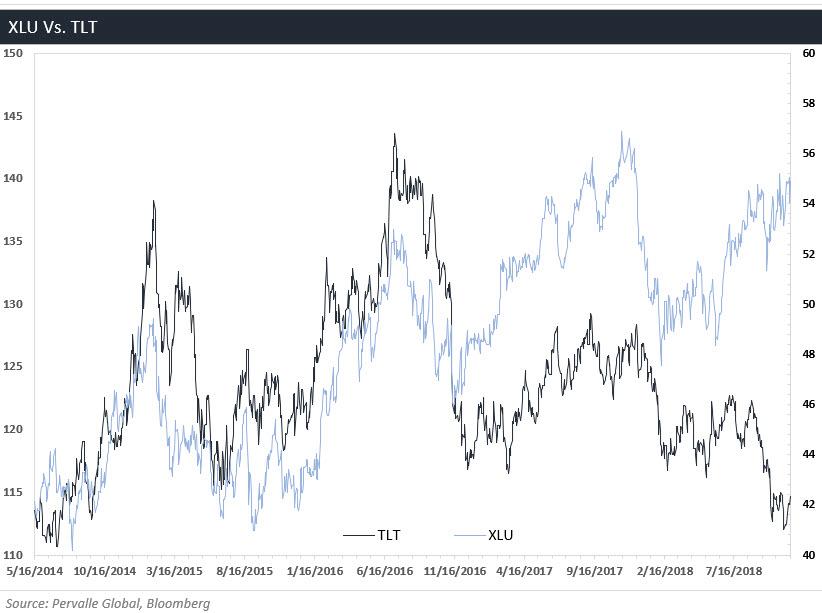
And our bond proxy – utilities – puts bonds prices significantly higher, thus rates lower.
We believe the markets are beginning to price in the current and developing slowdown in China, as well as higher rates in the US, which are weighing on housing and the US consumer. We see the bonds responding over the next six to eight months.
CHINA
In our view, China is the most important driver of global growth and the cycle. From 2012-2016 it made up ~34% of global GDP growth, more than the US, Europe, and Japan combined. It now represents roughly 70% of all manufacturing in Asian emerging markets, and is the largest importer of ~50 countries, up from 5 a decade ago. This growth has primarily been driven by an unprecedented amount of credit creation, which over the past two years has become much more of an interest to us.
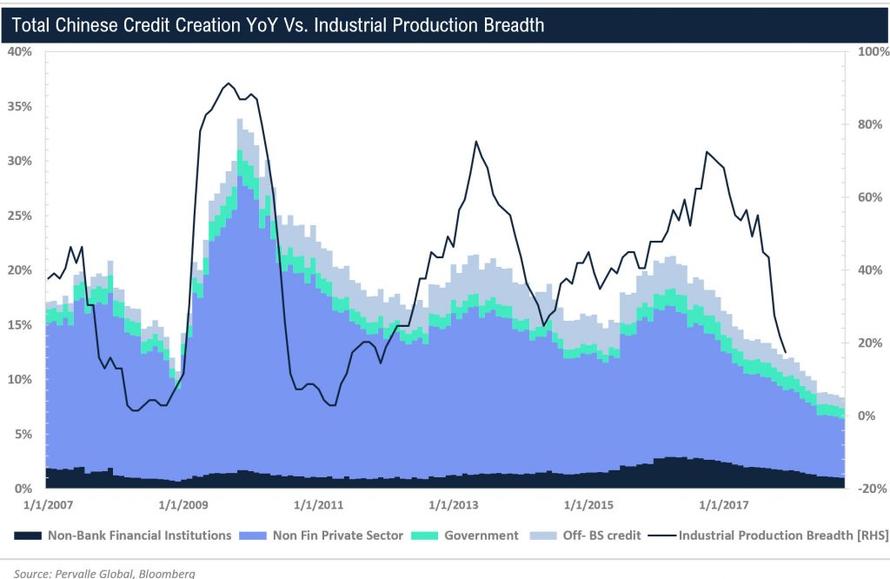
Breaking down the credit data below, we can see that Chinese credit creation has fallen from its peak of 21.3% YoY in Q216 to 8.34% YoY. While 8.34% YoY is still quite high, it is the rate of change that drives the cycle.
To put this in perspective, let’s look at the past year. The difference in the rate of change of credit created from October 2017 (+12.8% YoY) to October 2018 (+8.34% YoY) is equivalent to $940bn dollars, or roughly 7.7% of China’s GDP and 17% of their stock market. From the high in Q216, the rate of change has fallen by $1.9T, or 34% of China’s market cap.
This, however, is just the rate of change. Total credit creation over the past year is still strong at $2.55T YoY, equivalent to 21% of GDP and 11% of the S&P500.
We see this as the primary driver of the global cycle and it is backed up by the data. As you can see below, China’s credit creation leads our global industrial production breadth indicator by roughly 8 months. This indicator is designed to measure the strength of 23 OECD countries by taking the percentage that are growing over the prior year (breadth). Currently, the indicator stands at only 20% that are growing over the prior year and will likely trend lower over the next 8 months given the historical lead.
We are monitoring China’s credit creation over the next few months as there is a decent probability that it turns higher given the leading relationship of China’s bank reserve rate requirements (RRR). As you can see below, China’s RRR cuts typically leads total credit creation by roughly 5 months, which lines up with January (+/- 1 mo) being the turning point. Should we see an uptick in credit creation, this will likely start filtering through the economic data roughly 9-12 months later or towards the end of 2019. The prior uptick in credit started in June of 2015, which then found its way in the global PMI data in June of 2016. Equities began to price this uptick in in February of 2016, leading by roughly 4 months. Assuming the data follows this historical cycle, international equities should begin to sniff out a pickup in global growth in the second half of 2019, which is when excess liquidity also begins to improve as well (elaborated on below).

US ECONOMY
Over the next 12 months we see the US economy slowing materially, as the recent move in crude drags down industrial production and rising interest rates continue to hamper housing and the consumer. Crude’s 26% decline should have a material adverse effect on US industrial production given roughly 70% of IP growth over the past year has been concentrated in crude related line items. The move implies IP should fall to ~2.2% from 4.1% in October, which is consistent with 2.3% on the 10yr — in line with where most other markets are currently pricing rates.

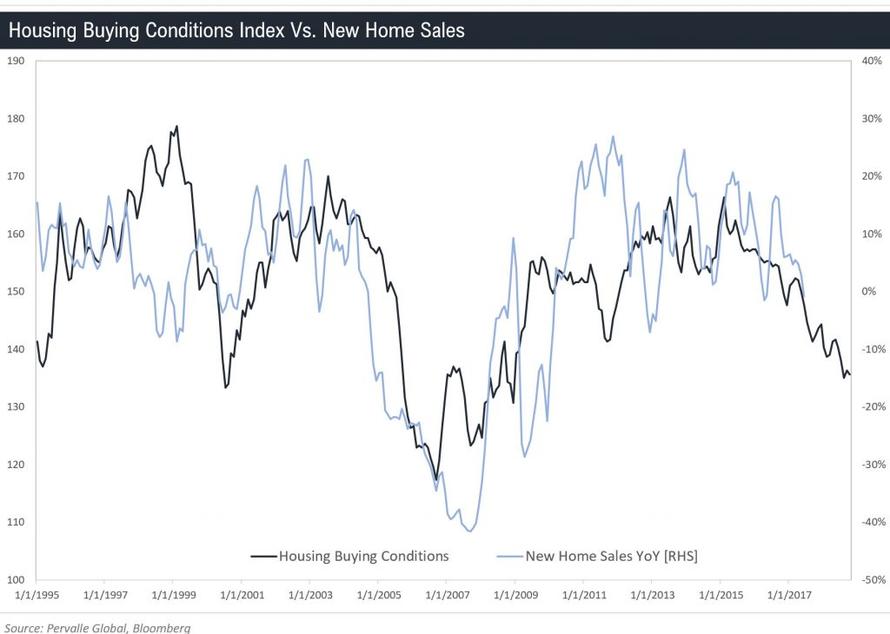
We are also beginning to see signs of deterioration in the housing market and retail sales, which will likely continue for the next 12 months, as higher interest rates further pressure consumption. Below we’ve overlaid consumer buying conditions for homes versus new homes sales. As you can see, buying conditions lead new home sales by roughly 2 years, indicating sales will continue to be pressured for the foreseeable future. This is showing up in the lumber market, with prices roughly 44% of their highs. Historically, lumber has been one of the best leads on the economy and US interest rates. It is currently pricing in the 10yr closer to 2.2%.
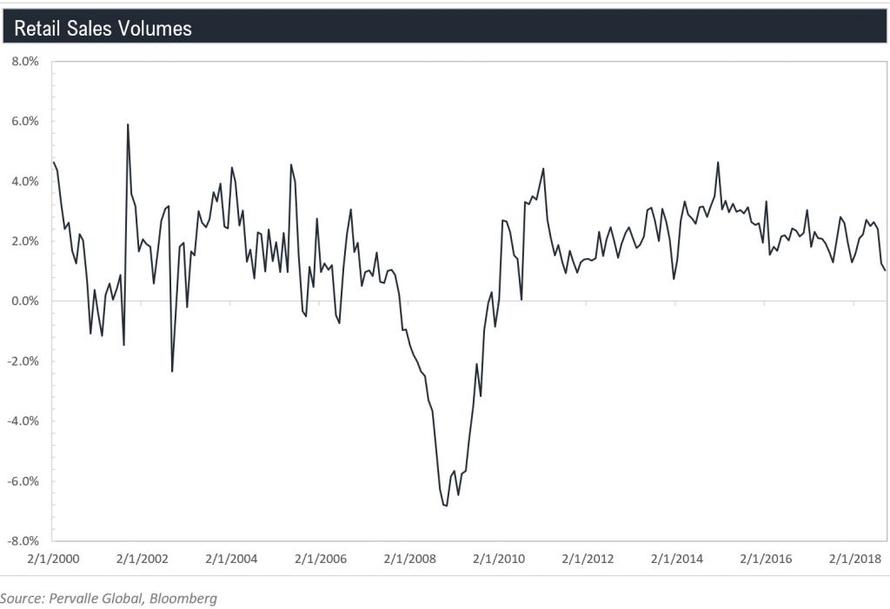
The same relationship is true for autos, as buying conditions have deteriorated, which will likely further pressure retail sales, as autos make up 20% of the aggregate. While auto sales have recently weighed on retail sales, top line numbers have remained resilient; however, we see some volume deterioration under the surface. As shown below, retail sales volumes – or retail sales adjusting for the price of inflation – have fallen materially. We derive this by taking the individual line items of retail sales and adjusting them for respective gains in inflation. For example, furniture, electronics and appliances were up 1.24% YoY in the most recent retail sales report, but inflation of those items was up 3.07%, indicating volume growth was negative. As you can see below, volumes are growing marginally above 1%, which is near the lowest level of this cycle.
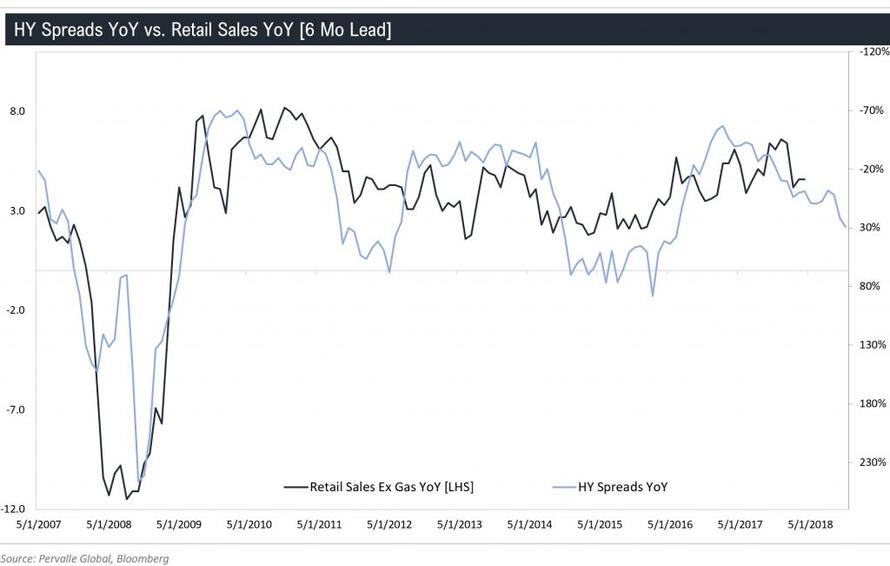
There is a high probability that those volumes continue to deteriorate given HY spreads YoY lead retail sales by roughly six months, as shown below.
While the economic data looks to be deteriorating, we are also seeing a significant drop in excess liquidity.
LIQUIDITY
Global liquidity should cap gains and pull equities lower over the next 12 months, as it is currently the lowest of the cycle. We can see this below via our excess liquidity indicator, which seeks to measure the dollars freely available to flow into markets. As excess liquidity rises, equities rise as there is ample money around, and vice versa. We are now witnessing the largest liquidity contraction in the past five years, which has historically led US equities by roughly 12-14 months – indicating that returns in 2019 should be quite poor. We see this providing a bid for bonds and an increase in flows, which the market is currently not discounting, specifically over the next 6 months.

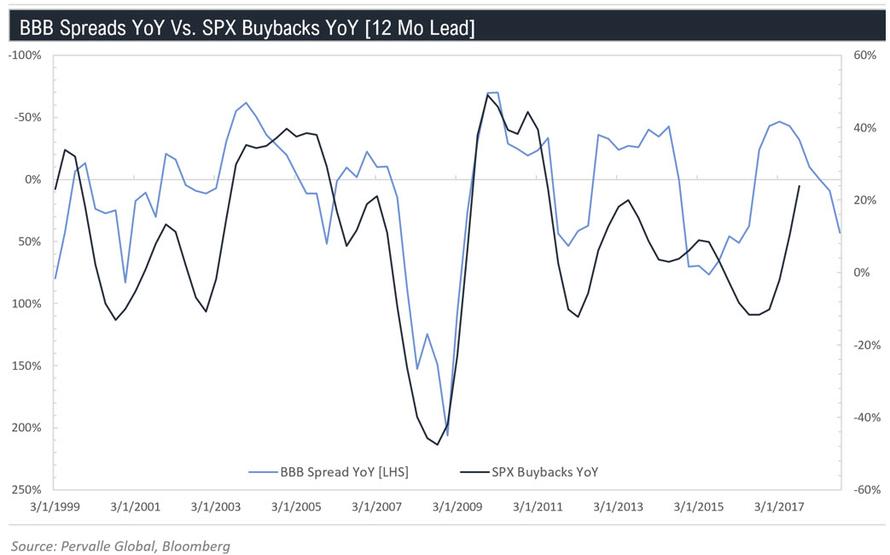
On top of this, we see the largest bidder – US corporates – going dark over the next 12 months as BBB spreads are indicating that buybacks should slow significantly, shown below. This is quite concerning as buybacks have totaled roughly $4.4 T since the beginning of the cycle, and ~$655Bn over the past year, representing over 80% of the bid to the market according to Bridgewater.
FED
Given the scenario outlined above, it seems highly probably that the Fed will begin to reverse course over the next 3-4 months, as both the equity market and fundamental data give them pause. But just like a large ship, it takes time for the Fed to move from one direction to the next, so the next step will be to walk back hikes in 2019 and possibly their balance sheet unwind. We see this scenario as being quite bullish for bonds, as most of the damage of the rate hikes is already filtering through the system. While the current perception of the fundamental backdrop is quite positive, we see the Fed’s reversal as a catalyst for the questioning of current conditions, and during this twilight period, the economic data should continue to deteriorate, which will then likely lead to a participant understanding that their thesis is likely incorrect.
CTA/Momentum players
We see the first 1/3 of the move in rates happening in short order due to the recent dynamics of CTAs and algos in the markets. Recent price action has been quite interesting, as bonds have failed to be bid despite risk off in equities and most markets implying rates much lower. We think this is due to CTA and algo momentum models driving price to a directional extreme, leading to record positioning that is then subsequently reversed in quick order. We have seen this over the past year in S&Ps, the Vix, copper, gold and recently in crude. We think bonds are next.
Technicals
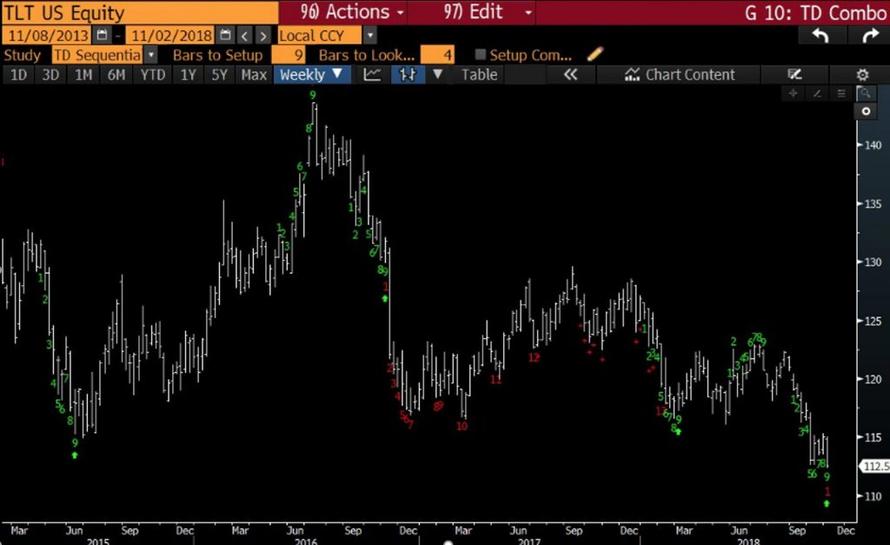
Technically, bonds look quite attractive as they’ve recently completed a weekly downside Demark 9. Historically, weekly downside 9’s have had an 85% positive hit rate over 60 trading days, which brings us into early February – where we see the majority of the move in yields happening by.
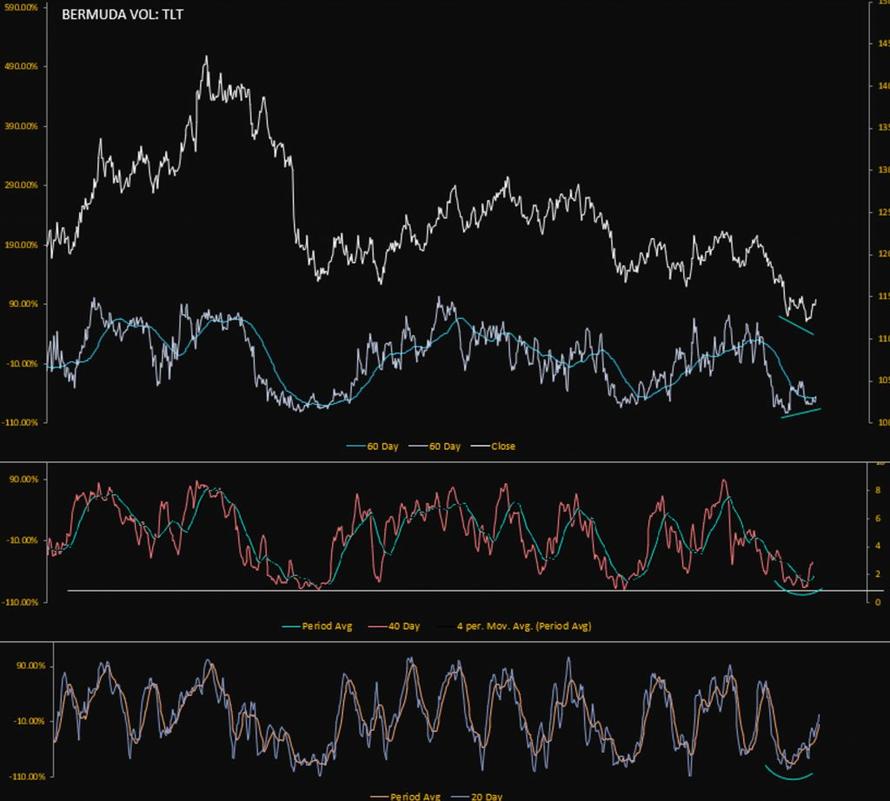
We are also seeing some positive divergences on our Bermuda Vol model, as shown below. This tracks momentum across multiple time frames and has flipped positive from the lower bands across the 20, 40, and 60 day.
Bear Thesis
Treasury Issuance
The market is currently very concerned about the fiscal deficit leading to large increases in treasury issuance. Estimates are for deficits of roughly ~$900bn on average per year out to 2023. Assuming this operating thesis and the numbers are correct, 10 and 30 year supply will only see a marginal increase, as they represent roughly 4.4% of gross issuances. Bills on the other hand represent roughly 78% of total issuance. Therefore, a large scale deficit blow out will pressure short rates, which is debatably bullish for the long end, as higher short rates squeeze economic growth.
Lack of Foreign Demand
The second leg of the bearish case for bonds is that foreign demand is slowing due to hedged returns that are now negative. This is factually correct and a concern on the demand side. That said, looking out over the next 12-14 months we do not see this being an issue. Hedging costs are essentially the difference between Fed Funds and the European Deposit rate, as well as the BOJ’s overnight call rate. During the past few cycles, hedged yields have compressed similar to the yield curve and then reversed as the Fed began to cut rates. Given our economic view, there is a high probability that these reverse as well and provide positive returns to foreign investors as the spread between Central bank rates have reached what look like their historical limits.
It should also be noted that the unhedged rate differentials between the US 10yr and the Bund recently hit an all time high of 2.78%, and 3.05% for JGBs – the highest of this cycle
Fed Balance Sheet
Last, but not least. is the Fed’s balance sheet unwind causing a large increase in supply, thus sending rates higher. Intuitively this would make sense, but historically looking at the data from periods of QE does not support this assertion. For example, from the beginning to end of QE1, the Fed purchased $277bn of treasury bonds, and rates rose by 22% (2.77% to 3.38%). QE3 saw the same thing, as $763bn in purchases led to a 31% rise in rates. QE2’s $844bn purchases did see rates move lower; however, it was only towards the tail end of the purchase program that they went negative – the first $803bn saw rates rise by 20%.
The point here is that we see rates being driven by the economic cycle versus changes in supply. We do not see the Fed unwind leading to a sharp rise in rates due to our view that the US economic data will continue to deteriorate through Q219. There is also a decent chance that the Fed begins to pause on unwinding its balance sheet; however, this is not integral to our thesis.
Conclusion
Given our thesis above, we see rates falling materially over the next 6-8 months before pausing or taking a brief time out. The next leg will largely be determined by China’s ability to expand credit and drive growth, which will be apparent in the data over the subsequent months. Looking out into the second half of 2019, there is still a high probability that the S&P 500 (2,736) moves lower due to poor liquidity conditions and falling EPS estimates – this is very supportive of bonds, which are technically set up for a strong move higher.
Over the next 8 months, we think it is safe to buy bonds and chill.
via RSS http://bit.ly/2MbckLx Tyler Durden