If one asks traders what was the common market theme over the fourth quarter, among the various (often angry) answers, one will stand out: general prevailing chaos, manifesting itself in soaring volatility which coupled with record low liquidity and a sharp pick up in trading volume, resulted in disjointed, erratic price action that crushed all momentum and trend-following strategies (which these days is most of them).
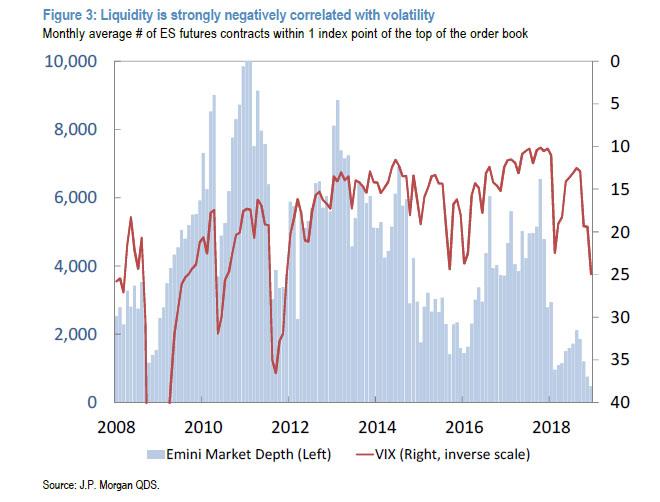
Commenting on this phenomenon among others, two weeks ago JPMorgan quant Marko Kolanovic said, correctly, that “liquidity has become to a large extent driven by market volatility” reinforcing a negative feedback loop between volatility, liquidity and investors flows, and as the most recent examples he cited the unprecedented drop in futures market depth or “record low liquidity” we discussed previously (shown in the chart below), the currency flash crash on Jan 2, or the equity market “upside crash” on December 26.
This topic was then picked up by Goldman, which expanded an this analysis by accounting for the third spoke of the market’s unholy trinity, namely trading volume, and how it impact the reflexive feedback loop between liquidity and volatility (readers can reread Goldman’s comprehensive market structure assessment at the following post).
And yet despite repeated attempts at explaining what happened, investor confidence in the stock market was badly dented by the concurrent spike in volatility, plunge in liquidity and pervasive accusations that algos (or program trading) were behind recent events which, for the most part, have remained quite confusing to even the most seasoned financial professionals.
Of course, none of that is new, as the following January 1988 ad from none other than Shearson Lehman reminds those who may not have even been born when Black Monday struck.
So in a follow up attempt to explain the nuances of the recent violent market moves (in response to what appears to have been significant client confusion as most investors are still unaware that in the new abnormal, “liquidity is the new leverage” as Goldman Sachs explained last July), JPM’s head quant Marko Kolanovic has published one of his most in-depth, and objectively informative, notes in months elaborating on the feedback loop between volatility, liquidity, and flows, a loop which he calls simply “market fragility” (something Goldman has also repeatedly touched upon, most recently in “Goldman: 2019 – Lower Liquidity, Higher Vol, More Fragile.”)
By way of background, Kolanovic says that “interest for this topic comes from various clients – those that are assessing the impact of flows to the broad market and their portfolios (fund managers), those that position for and anticipate these flows (speculators), and those that are assessing the robustness of different systematic investments (investors).”
So in order to provide some additional clarity to clients, first the quant demonstrates the link between Volatility and Liquidity, something he did several weeks ago, while demonstrating how market depth – the key measure of liquidity – got decidedly worse over the past decade as central banks took over.
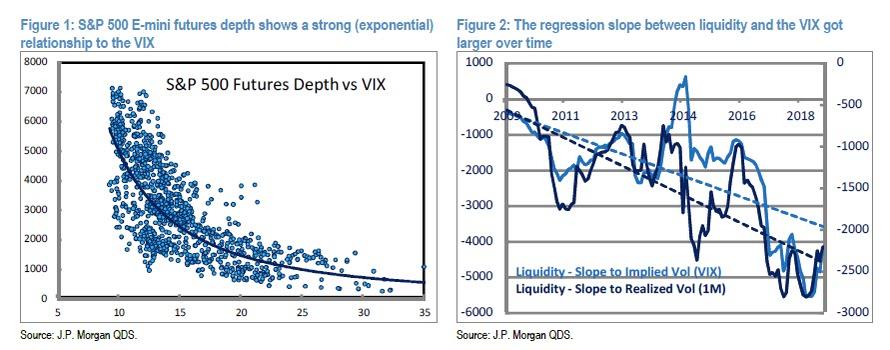
Figure 1 shows the relationship between S&P 500 futures market depth and the VIX. One can notice that this relationship is very strong and nonlinear (e.g., market depth declines exponentially with the VIX). Given that an increase in volatility often results in systematic selling, this relationship is the key to understand market fragility and tail events. The second question was if this relationship was always the same or the situation got worse over time. To answer this we show the historical relationship between liquidity and the VIX over time (Figure 2, rolling regression slope between liquidity and the VIX). One can see that the negative relationship between liquidity and the VIX got worse over the past decade (note that an exponential relationship can be locally approximated with a linear relationship and tracked over time).
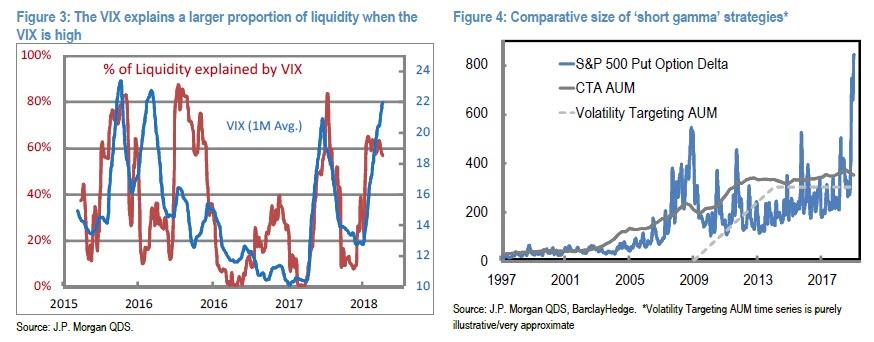
Finally, we note that at times of high volatility, the VIX is almost the sole driver of market liquidity. Figure 3 shows the % of liquidity variation that can be explained with the VIX over time (rolling R-squared). The higher the VIX, the more liquidity is driven by the VIX, and recently up to ~80% of liquidity variations were explained by the VIX. To conclude, we showed that there is a negative relationship between volatility and liquidity, that this relationship is getting stronger over time, and that it is particularly strong during times of elevated volatility.
Having covered the two core spokes of modern market (mal)function, namely liquidity and volatility and their constant interplay, Kolanovic than shows that volatility also plays a significant role in determining the flows from various systematic strategies (he defines systematic flows to include derivatives hedging flows, passive and quantitative investment strategies flows, insurance industry and programmatic market making flows).
According to the JPM quant, and as traders observed all too well last December, an increase in volatility – whether fast or slow – usually leads to an increase in systematic selling, which happens in an environment of reduced liquidity, thus producing outsized market impact and increasing overall market fragility – it is no surprise that flash crashes tend to occur most frequently when the VIX is will north of 20. Kolanovic also notes that during times of high volatility/low liquidity, “not only systematic strategies but also discretionary managers sell, albeit typically they tend to sell slower and/or later during the sell-off episodes.”
To represent these observations in practical terms, Kolanovic looks at the various examples of systematic flows, their impact on the market and their own performance, and speculative activity related to these flows:
The largest of all systematic flows by size and impact is that of index options hedging. Figure 4 shows the delta weighted open interest of S&P 500 index puts, in comparison with an asset estimate of two other ‘short gamma’ strategies – CTAs/Trend-Following and Volatility Targeting strategies. One can see that the largest component of systematic flows comes from option hedging, but given the increase of trend-following and volatility targeting these components cannot be ignored.
In periods when volatility begins to rise, option hedging flows tend to significantly impact the market near the close as it takes a few days before speculators establish the positioning and hedging patterns and start anticipating these flows.
Besides index delta hedging, another systematic strategy with predictable flows according to the JPM quant is levered and inverse exchange traded products: similar to index options hedging, “these products are short gamma (note that levered/inverse ETF gamma is typically much smaller than index option gamma).”
And since the flows are “predictable”, a feature aspect of this strategy is that given that levered and inverse ETFs are short gamma, their rebalancing results in systematic flows that can be anticipated by speculators, which negatively affects the performance of these products, creating a potentially destabilizing feedback dynamic. The best, and most recent example of this, is the demise of the inverse volatility product XIV:
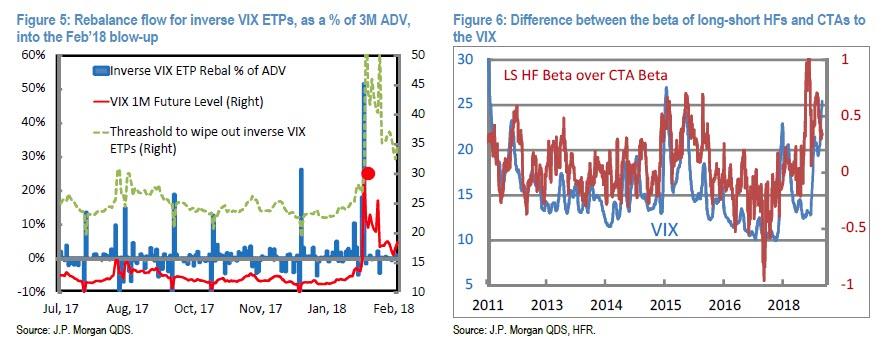
When volatility increased in February, the size of rebalance could not be digested by the market. Liquidity providers, with knowledge of large rebalance flows, were not eager to step in until the product self-destructed. Figure 5 shows rebalance flow as % of average daily VIX volume as well as the level of the VIX at which product ‘self-destructed.’ As soon as the VIX “tagged” this level, volatility quickly subsided.
Continuing down the list of strategist that are short gamma, we next encounter trend following and volatility targeting strategies.
As Ray Dalio knows all too well, volatility targeting can be applied to any portfolio (e.g., 60/40, risk parity, factor portfolio, a platform of fundamental PMs, etc.); furthermore, vol-targeting is explicitly short gamma in a mean-reverting market. As Kolanovic explains, the reflexive strategy reduces risk when volatility is rising and increases risk when volatility is falling. This is by design (risk exposure ~1/volatility), and in that way flows from these strategies are closely related to option hedging. It also means that once the market begins selling, most of these short gamma, procyclical strategies reinforce the move lower and vice versa; it is therefore the inflection points that tend to be the most violent.
In terms of market impact, Kolanovic notes that in his estimates, the notional amount of these strategies at ~$300bn in mutli-asset portfolios, which is much smaller than the delta weighted put open interest in Q4 of ~$750bn notional just for the S&P 500 index. In addition, these strategies sell over several days (unlike option hedges that sell within a day). Similar to the other abovementioned strategies, CTAs’ short gamma exposure is not explicit, but still intuitive as they sell when an asset price declines, and buy when it goes up.
That said, not only systematic investors sell into VIX spikes. Ordinary equity long-short hedge funds also sell into VIX spikes, but less programmatically and certainly less aggressively.
An indication for this is the sensitivity of funds’ beta to the VIX. For instance, CTAs’ beta to the VIX is about ~4 times higher than equity long short HFs’ beta to the VIX (e.g., -3.5% vs -0.9%). Figure 6 shows the difference between the beta of equity long-short HFs and CTAs and the VIX. When the VIX increases, CTAs are quicker in reducing beta (selling stocks) than equity long-short hedge funds.
Here Kolanovic explains that while his analysis does not “pass judgment” on the merits (or failings) of various short gamma systematic strategies that are often used for hedging or risk control, he observes that “these strategies require adjustments due to the changing market environment” (e.g., liquidity-flow-volatility feedback loop, speculative flows, etc.). But most notably, again, is the reflexive nature of these strategies, where the change in flows becomes a signal impacting future changes in flows, creating a self-reinforcing feedback loop, or as Kolanovic states, “if systematic flows are significant enough to impact the market, they will impact their own performance via speculative flows and market impact.”
Finally, to list which strategies would be impacted, the JPM quant suggests that some simple checks would include:
- Strategies where the asset base and flows are large relative to market liquidity (i.e., crowding).
- Strategies where the flows are correlated to volatility. The reason for this is the volatility-liquidity-flow feedback loop, which makes the effective asset size ‘appear larger’ than it is. Strategies that are inherently short gamma are affected more.
- Strategies that are entirely transparent and don’t adjust along the way (e.g., if a strategy is documented in a prospectus or academic whitepaper, it will more likely invite ‘copycats’ or speculative flows).
- In addition to the above, poor performance of a strategy may indicate crowding or damage from speculative flows or short gamma exposure
While the above explanation should provide a much needed framework for analyzing market moves during periods of increased volatility (and declining liquidity), it will hardly satisfy a market where an entire generation of traders have yet to see a full-blown bear market, which is why the next time a selloff emerges, expect virtually nobody to understand any of the above, and why explanations by market quants meant to elaborate the various feedback loops between the market’s key spokes, namely liquidity, volatility and capital flows, will be promptly forgotten, and the most likely response will be another bout of aggressive selling followed by demands that the Fed bail everyone out. As the events of December and January demonstrated, this may well be the best “strategy” for the foreseeable future.
via RSS http://bit.ly/2RQz08Z Tyler Durden