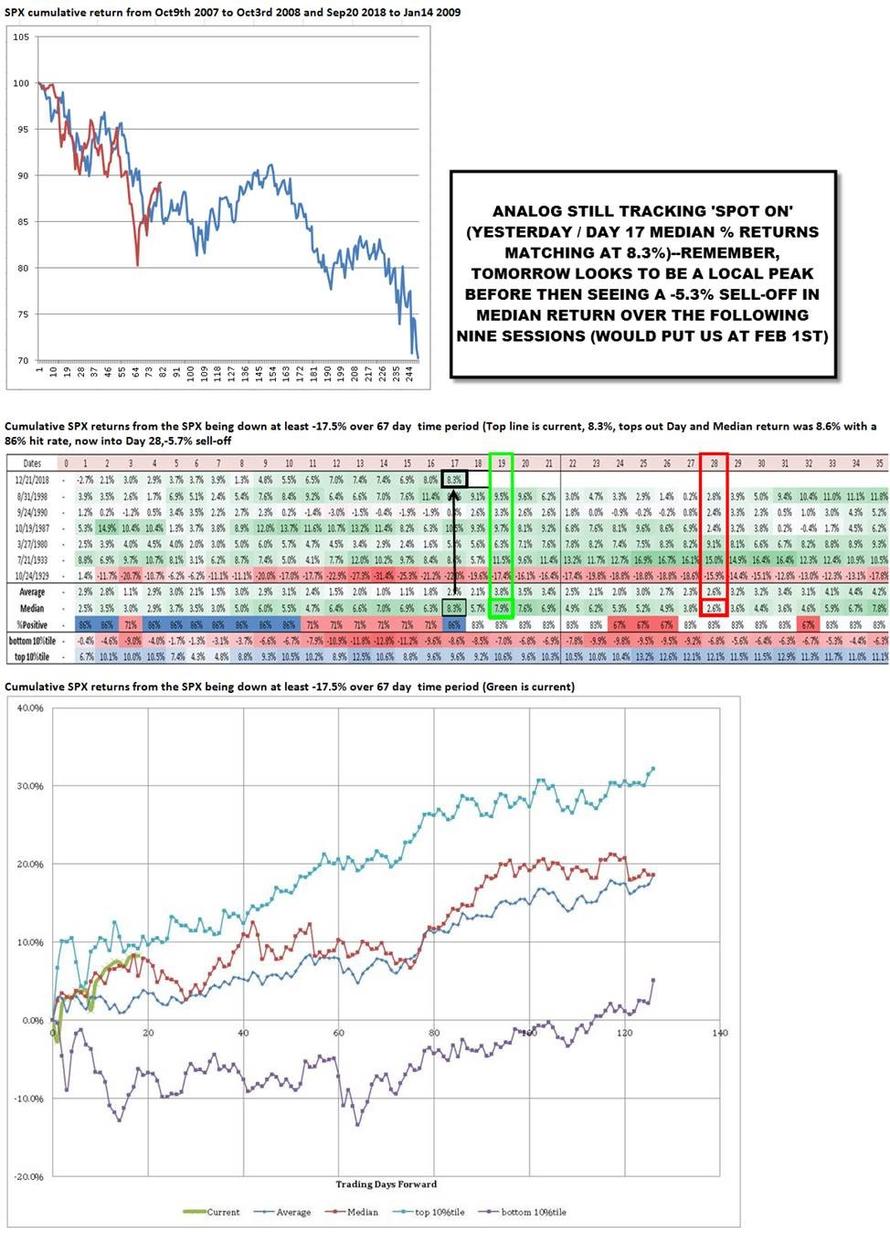
One day after spooking markets by predicting that, in keeping with the infamous Lehman analog, equities may peak on Friday before taking another sharp leg lower, Nomura’s Charlie McElligott is double down by pressing on the “tactical bear” case, and in a note to clients writes that “for the first time in a long while, US Equities index downside looking attractive, with put-spreads offering handsome leverage again as 1m downside skew has gone from 25th %ile to 68th %ile over just the last two weeks.“
One reason for McElliggott’s creeping skepticism has to do with the fact that just as many systematic factors covered many of their shorts and some turned outright wrong thanks to the recent bear market rally, this may be just the time when they are forced to reverse, as a fresh set of systematic traders seek to stop out existing positions, especially should 2,600 on the S&P, which has turned from resistance to support is taken out.
As we discussed over the past week, as the market ground higher, more trend-followers piled on, reversing their first short in three years, established in late December. And McElligott explains, this equities re-leveraging initiated by “first-mover” systematic strategies appears to have begun “dragging in” fundamental/discretionary funds, with Nets- and Grosses- “tickling” higher as per Street PB data, with Goldman data showing that “gross-exposure” jumped the most last week in nearly 1.5 years.
Additionally, and in keeping with Marko Kolanovic’s latest note on how liquidity/volatility and flows are all interlinked, S&P consolidated Deltas are again positive for the first time in over a month, largely as a function of the rally with Calls over Puts, while the Nomura strategist says that he has seen the recent “Short Gamma” of Dealers “flip” again “Long Gamma” at current levels, helping foster this calm-er “grind higher” through earnings.
Which, to put it simply, means that with most marginal traders once again positioned bullishly, the pain trade is naturally lower. And, according to McElligott, a move down through 2575 in SPX, the new gamma-gravity inflection point, “would see the consolidated Gamma profile pivot “Short” which could then elicit “sloppier” moves.”

The chart below shows graphically the combined gamma exposure per 1% move vs the spot: it confirms that if the S&P dips back under 2,575 the selling pressure will return with a vengeance.

In light of this potential reversal, McElligott’s advice to “long-term investors” is to utilize the ongoing “positioning recalibration rally” as an opportunity to rotate into a “late-cycle” posture, by adding to “value” over “growth” names:
This “Val over Gro” dynamic is supported / corroborated by the developing multi-month yield curve steepening which began after the Fed’s powerful “dovish pivot” in Dec, as policy normalization ends and now markets begin pondering the commencement of the next EASING cycle
There is another trade for those who believe a re-test of the lows is imminent (or Nomura’s 2007-08 analog is accurate, which would require a “blow-up” in the market), namely buying vol as VIX outright upside is back on Nomura’s radar with VIX 1m upside is 17th percentile/2m upside is just 15th %ile dating back to 2006.
In regards to buying vol, Charlie spotlights yesterday’s “vol up, spot up” phenomenon as potentially an artifact of yesterday’s VIX print “buy-imbalance”—but without a doubt, he sees the VIX is acting “sticky” and looks “floored’ at ~ 17-18-19, with a large part of VIX “holding” here due to earnings impact/dispersion. To this “earnings as catalyst for VIX-move” observation, Nomura writes that the commencement of the still hyper-crowded Tech/Growth EPS will likely act as the key directional input (as a reminder, NFLX reports after the close, and is already up YTD).
However and in a potential “risk-bullish” catalyst from a forward-looking perspective, I continue to watch the VIX curve edging nearer to its “normal” upward slope the longer the Equities recovery persists, which as previously-noted would force systematic “roll-down / roll-up” strategies in VIX futures to reverse their “long vega” positions held since the VIX curve inverted ~4m ago, and instead dictate a potential pivot back towards “short vega”
This too of course dovetails into the entirety of negative convexity strategies which allocate leverage / sizing on “vol triggers”—where in-light of this violent Equities snapback off the Dec 24th lows, we’ve seen SPX 10d historical vol collapse from highs of 41.786 (made Jan 4th ) to yesterday’s 17.795 closing level
Finally, as McElliggott concludes conceding that all of this “hypothetical potential forward-catalyst for Equities via 1) trailing Realized Vol trajectory and / or 2) the VIX curve “flipping’ aside”, his near-term directional analog of the 2007-08 trade vs this Sep 2018-current “continues to drive a ton of client inquiry” and for a good reason: it suggests that the pain is only just starting.
via RSS http://bit.ly/2TVKtl3 Tyler Durden