After a year of tapering, the Fed’s balance sheet finally captured the market’s attention during the last three months of 2018.
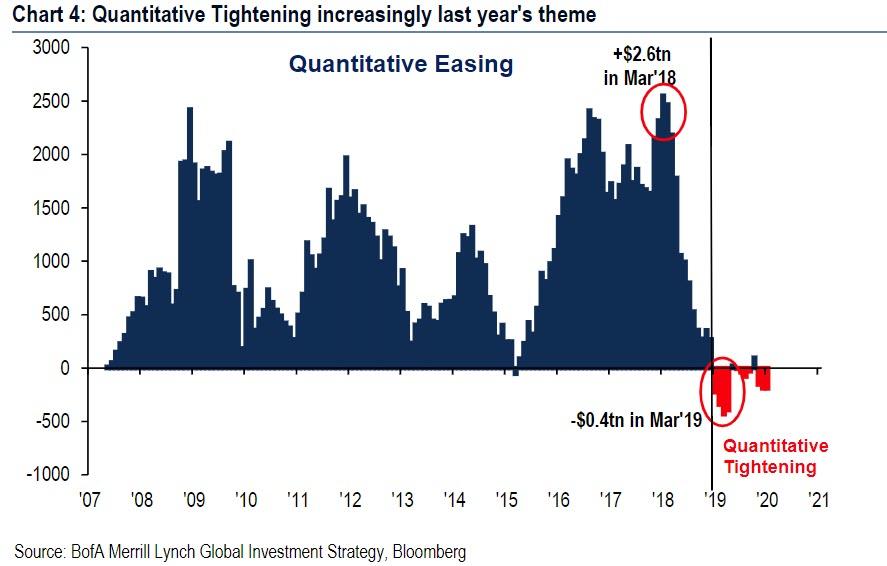
By the start of the fourth quarter, the Fed had finished raising the caps on monthly roll-off of its balance sheet to the full $50bn per month (peaking at $30bn USTs, $20bn MBS, although on many months the B/S does not actually shrink by this full amount which depends on the redemption schedule) and by end-Q4 markets also experienced some of the largest volatility and drawdowns in nearly a decade. As Nomura’s George Concalves writes in a Friday letter, whether it was a coincidence or not, broader markets questioned the Fed’s original view that B/S roll-off was going to be like “watching paint dry.” Indeed, recent Fedspeak has shifted to being more open-minded, with Fed policy makers suggesting that they are prepared to be “flexible” in implementing their balance sheet policy.
The reason for that is that as both the market and the Fed (and especially Chicago Fed president Charles Evans) were violently reminded, just as QE added liquidity and boosted all asset prices, so QT is draining liquidity from the system. Worse, as Marko Kolanovic wrote in his latest report from Jan 16, given the recent collapse in liquidity and the toxic feedback loop of flows- liquidity-volatility which we discussed last week, “investors are very attentive to monetary policy measures that may affect liquidity.”
And since the most closely watched metric of systemic liquidity is once again the pace of the Fed’s balance sheet change, and specifically, reduction, Kolanovic notes the recent example of a sharply negative market reaction to the comment that balance sheet reduction (Quantitative Tightening or QT) will be on autopilot (and positive reaction when this statement was later modified). Additionally, even casual remarks on the balance sheet has dramatic and “significantly negative intraday impacts on markets” (such as Powell’s recent remarks that the balance sheet should be “substantially smaller”).
But why, Kolanovic asks rhetorically, is there such a focus on the Fed’s balance sheet from investors?
The answer is obvious: by now only clueless hacks will deny that adding liquidity in the form of QE was the single, most important factor driving asset classes higher over the past decade. According to JPMorgan, the impact of QE was ~20% of equity prices (see the bank’s report here).
Yet while qualitatively the answer is simple, complications arise when one tries to quantify the impact of the balance sheet shrinkage. Specifically, as the JPM quant notes, the questions investors struggle with are how negative was/will be the impact of the QT, to wit: “It is plausible that dollar for dollar, QT has a significantly larger impact than QE.”
The reason for that, according to Kolanovic, has to do that may be the previously discussed fragility feedback loop. During QE, both central banks and investors, and certainly HFTs and algos, would broadly buy assets in an environment of low volatility/ increased liquidity when the impact is small, while during QT “assets are typically sold while liquidity is removed, compounding the negative impact of other outflows.”
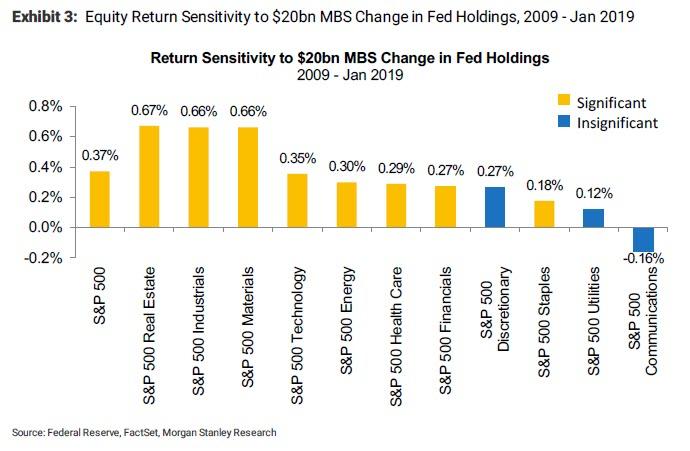
Others have also tried to quantify the impact of QT on risk assets, most recently Morgan Stanley, which last week calculated that every $20 billion decline in Mortgage Backed Securities held by the Fed leads to a 0.37% drop in the S&P (curiously, MS found that S&P 500 returns are not significantly correlated with changes in the Fed’s Treasury holdings, although that observations will surely be retested soon).
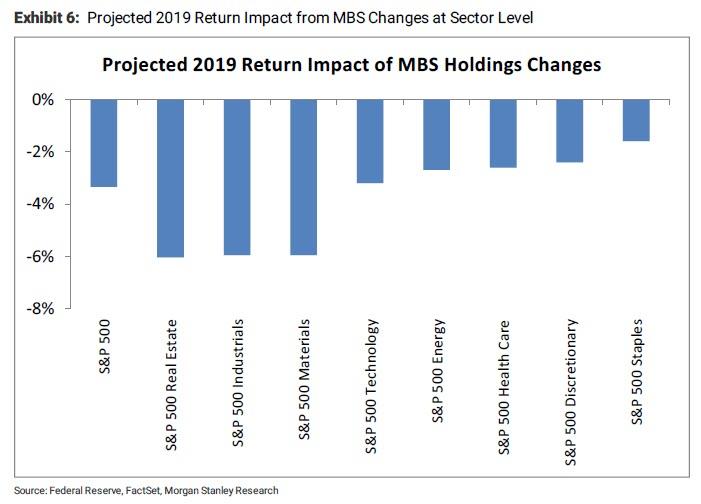
As a result, Morgan Stanley calculates that based on the recent MBS runoff of $15bn per month, the projected S&P 500 return impact is -3.3% for 2019, with the real estate sector hit the hardest.
Yet while Morgan Stanley believes it may have found the causality link between the Fed’s B/S size and its impact on the market, JPM disagrees, and in his note Kolanovic assets that to his knowledge, “there is no broadly accepted understanding of the exact mechanics and magnitude of QT’s impact (e.g., how much it is a signal to the market, vs. mechanical supply/demand and price impact).”
Instead, he suggests that while there is a significant relationship between the Fed’s balance sheet changes and the market, the big drivers of this relationship are points when the large QE programs were announced such as March 2009 (e.g., when this point is taken out, the relationship no longer appears statistically significant).
In other words, unlike Morgan Stanley’s attempt to extrapolate correlation into causation, JPMorgan is more intellectually honest, stating that “whatever the real mechanical impact of QT is, the indirect impact on market sentiment is likely much larger”, in other words stocks drop as traders expect QT to drain liquidity and impair stocks, selling in the process and resulting in a self-fulfilling prophecy.
In a somewhat similar analysis, Nomura fixed income strategist George Concalves suggests a compromise option, noting that while his own analysis found little correlation of the smaller balance sheet to the SP500 (“unlike what was seen during the QE days where stocks had an eerie visual relationship to the actual size of the B/S”) he did notice weekly B/S changes could be impacting markets.
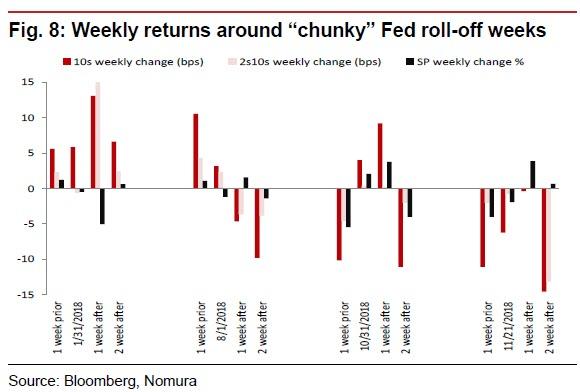
As an example, he notes that the weeks where MBS holdings were paying down and/or weeks around the time the total size of the roll-off for both UST and MBS exceeded $20bn, markets would come under pressure with the most striking of those periods at the time being the February VIX shock. Additionally, in 2018 there were some “chunky” roll-off and around those weeks there was market volatility and drawdowns (especially in late October and November). To fine tune its analysis, Nomura looked at market performance for a few weeks after large roll-off weeks. It found that while in Feb 2018 it looks like the higher 10yr rates impulse was just as easily the driver of the SP500 declines a couple weeks later, by end-2018 the QT narrative was well entrenched and even then stocks would decline either before or after the larger rolloff periods.
So confirming Kolanovic’s view that QT is a self-fulfilling prophecy, Goncalves muses that perhaps “markets were anticipating these moves and discounted them. Meanwhile, going back to Kolanovic’s reflexive take on QT and the market, the JPM strategist notes recent intraday movements on balance sheet mentions, as well as the price action of the S&P 500 during Q4 shown in the chart below.

So what does all this mean for markets?
The answer remains generally unclear, with Nomura concluding that while it believes that “QT is tightening”, it is not “straight forward and seems to come in rolling aftershocks of liquidity draining and markets adjusting positions.” Meanwhile, the more actue impact of MBS QT on markets “makes sense as those securities are not zero-risk weight (as are USTs) and take up capital and/or need to be a substitutes for other credit products (which impacts FCI).”
Going back to Kolanovic, the JPM quant generally agrees with Nomura, and writes that while there may be little or no mechanical impact on equity prices, most macro traders will not “fight the Fed”, meaning when liquidity is added they are buying assets, and when liquidity is removed they are selling assets. Finally, to justify his thesis that QT, for now at least, impacts markets largely as a result of feedback loops and quirks in behavioral finance, Kolanovic also notes that over the past months, “we have heard a large number of anecdotes where investors avoid buying risky assets during (or actively sell into) weeks when there is a significant balance sheet reduction, e.g., traders taping the schedule to their screens, blogs and email chains, etc..“
JPMorgan’s conclusion: whatever the mechanism or sequence of events by which QT affects markets, there is no denying that the shrinking of the Fed’s balance sheet does affect the S&P in an adverse way: “balance sheet reductions put significant strain on market sentiment, on flows and on the weakest link in the market – the liquidity-volatility-flow feedback loop. If the balance sheet reduction is a signal to sell, volatility increases, liquidity decreases, and additional systematic flows are triggered.” As a result, Kolanovic warns that “balance sheet driven market fragility is thus increasing the risk of market disruptions and ultimately the risk of a recession – which is in contrast to policy makers’ intentions.”
Naturally one can argue this point very easily, and note that if true, then Kolanovic’s assessment suggests that absent the Fed’s balance sheet, the world would be in a singular depression right now if indeed the modest shrinkage of the Fed’s balance sheet from $4.5TN to $3.9TN risked a recession. Consider that there is still another almost $2 trillion to go before the Balance sheet is “renormalized” and one can see why the Fed is not only trapped, but will never be able to renormalize without jeopardizing both the fake market and global economy erected over the past decade on the back of $16 trillion in central bank balance sheet expansion, i.e. liquidity.
But that’s a problem for another day.
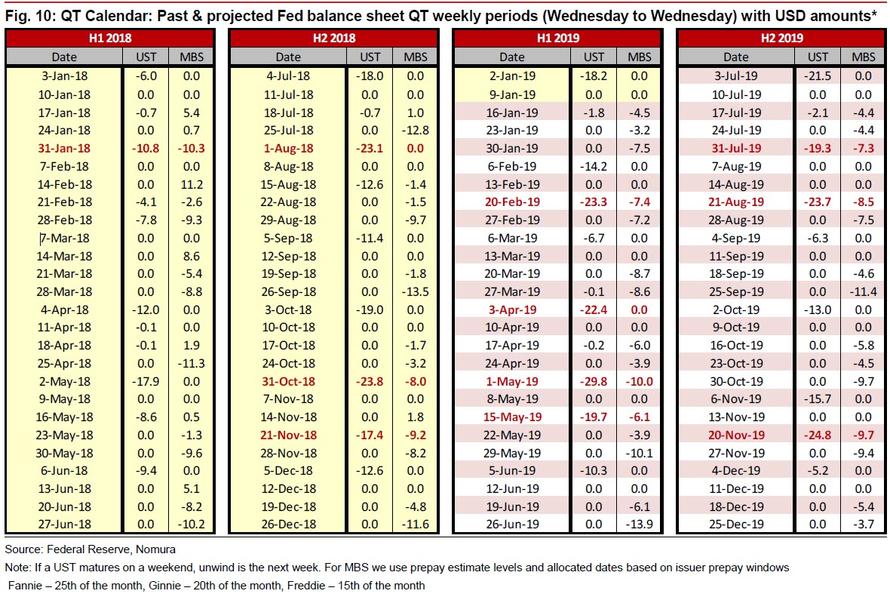
For now, we’ll conclude with the schedule that JPMorgan says “traders tape to their screens, blogs and email chains” – the complete QT calendar consisting of past and projected Fed Balance sheet QT periods, courtesy of Nomura’s George Goncalves. Needless to say, self-fulfilling prophecy is most likely to be validated during the “dangerous” QT weeks which are highlighted in red, when the Fed’s balance sheet shrinks especially aggressively,such as Feb 20, April 3, and May 1 and 15.
d
via RSS http://bit.ly/2U3YGg4 Tyler Durden