Authored by Bryce Coward via Knowledge Leaders Capital blog,
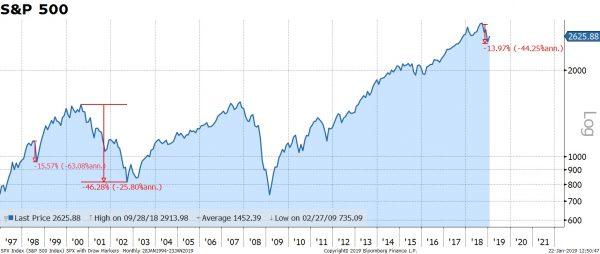
As a conceptual exercise, it may be useful to frame the current episode of market volatility (both upside and downside volatility) from the perspective of the stock market declines in 1998 and 2000. This is because the market decline in 1998 (fueled by the disrupting failure of Long-term Capital Management and the sharp devaluation of the Russian ruble) was quickly arrested and stocks went on to increase by another 58% before they eventually peaked and the real bear market started.
So, if the current environment looks more like 1998 than 2000 then this market cycle could still have another few years left and new all-time highs could be right around the corner. If, on the other hand, 2000 is a better analogy, then we could have bigger things to worry about.
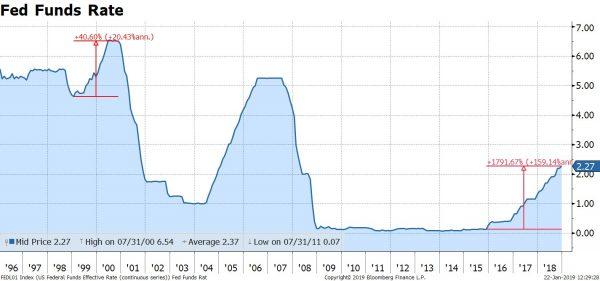
Let’s start with interest rates. Prior to the market decline in 1998 the Fed Funds rate had been basically flat for more than two years. This is in stark contrast to the market peak in 2000 when the Fed had raised rates by 41% over 17 months. More recently, the Fed has raised rates by 1792% over 37 months, not to mention the balance sheet runoff policy. So from the view of monetary policy, 2000 is clearly the better analogy.
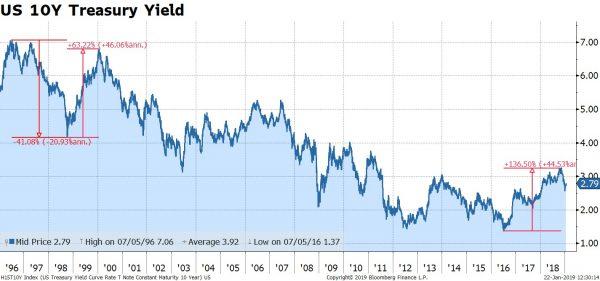
Long-term rates show us an even starker difference between 1998 and 2000. 10-year rates peaked in 1996 and had been falling for nearly two years before Long-term Capital Management (LCTM) failed and the selloff ensued. By late-1998 10-year yields had fallen by 41%. In contrast, long rates rose by 63% from the 1998 trough to the 2000 peak. That is to say, the selloff in 1998 took place in an environment of easing financial conditions and the selloff that began in 2000 took place in an environment of strongly tightening financial conditions. More recently, 10-year yields rose by 136% over the few years leading up to the September peak.
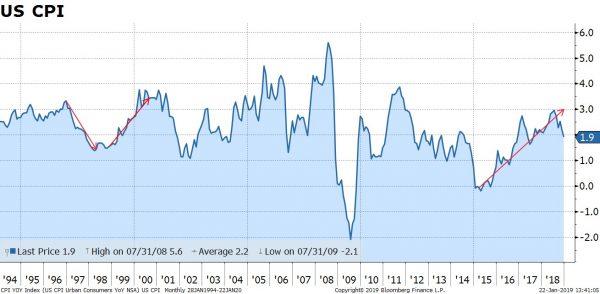
Changes in consumer prices can also be thought of as to contributing to either tightening or loosening financial conditions, with a lag. Price declines are stimulative while price increases are contractionary. For the several years leading up to the blowup of LTCM, consumer prices were declining. This allowed the Fed to sit on its hands while economic growth remained strong. But, the growth rate of consumer prices more than doubled from 1998 to 2000, putting pressure on corporate health. Similarly, consumer prices moved from about 0% to 3% from 2015-2018.
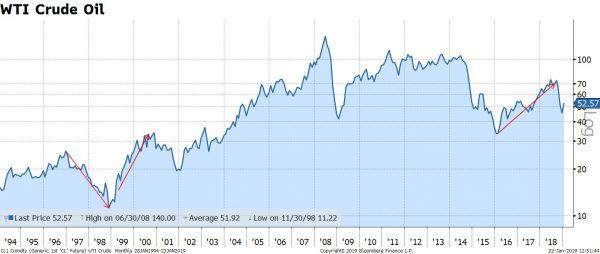
Crude oil prices, which admittedly played a larger role in constraining or stimulating US growth prior to the Shale Revolution than they do now, were declining strongly into 1998 vs rising strongly into 2000. Recently, crude oil prices more than doubled off the 2016 low. This has been a boon to oil producers, but a drag on non-oil consumption.
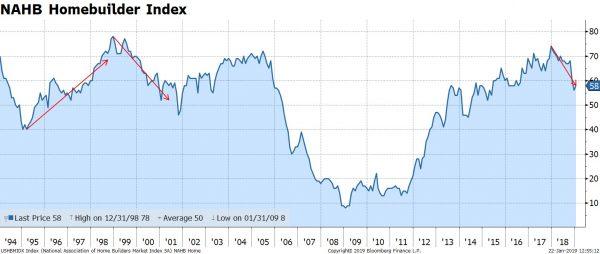
Finally, housing. Homebuilder sentiment was rising strongly from 1994 through 1999 and housing was an important support for growth that whole period. Housing was able to flourish because long-term bond yields/mortgage rates were generally declining. Rising rates finally started to impact housing in late-1999, and that marked the end of housing as a support to growth for the cycle. More recently, this measure of housing activity peaked in early 2018 as long-term interest rates/mortgage rates broke out to multi-year highs. It is unclear whether the decline in rates we’ve witnessed since the summertime will be enough to cyclically rescue housing, or if rates will need to decline significantly more in order for housing to get its mojo back.
As ever, the setup is one thing, and the policy response is quite another. The setup now looks a lot more like 2000 than 1998. That is, it’s a late cycle setup. Markets were able to shrug off the exogenous shock of LTCM because financial conditions were already stimulative and then the Fed followed up with rate cuts. Financial conditions leading up to 2000 were tightening, as they have been for the last 2+ years. There are many policy responses currently that could turn back the clock on the cycle. For example, the Fed could cut rates and/or stop shrinking its balance sheet, trade uncertainty could be removed, or China could continue to stimulate growth. In our opinion, the late cycle dynamic, which is so analogous to 2000, mean policy responses to unfolding events will be of utmost importance to determining the cyclical fate of the markets.
via ZeroHedge News http://bit.ly/2CJkTZA Tyler Durden