Authored by Sven Henrich via NorthmanTrader.com,
This last week had something for everybody. Bears got a 50-60 handle pullback on $SPX, bulls got a defense of the 50MAs amid continued sweet talking of markets by political leadership and central banks. The empire continues to strike back leaving room open for the bull case while global fundamentals continue to deteriorate. Net net markets ended virtually unchanged on the week leaving bulls and bears squaring off in the neutral zone.
Let’s look underneath the technical hood so to speak to evaluate any new evidence.
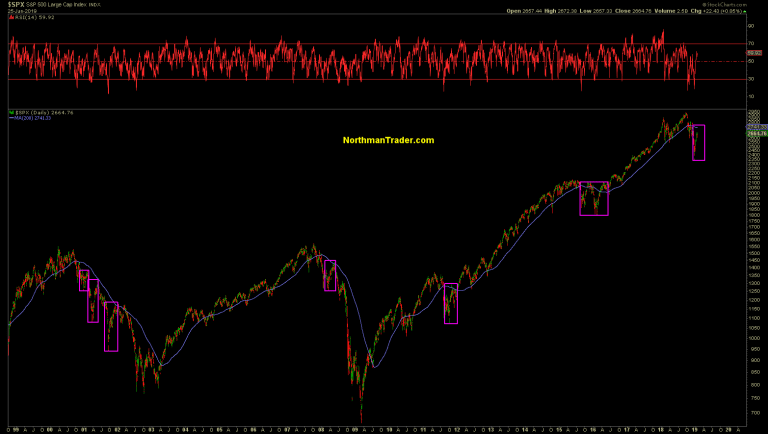
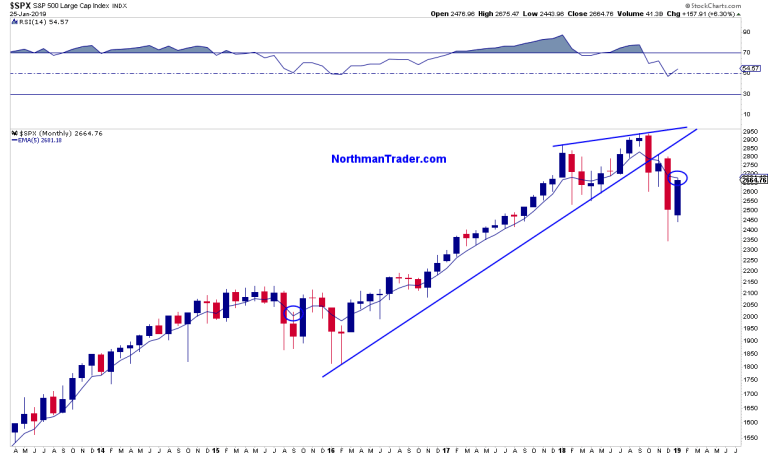
Let’s start with the obvious. This January 2019 so far is looking little different compared to January 2018:

The only thing that’s really changed are the narratives and technical context. Last year the rational for buying stocks in linear fashion was record earnings, the tax cut and optimism, this year the rational is now dovish central banks and hope for a China deal as fundamentals are deteriorating.
Curiously enough, while the price ascension looks virtually the same, price so far has paused right at the end of year 2017 price level from which the January 2018 rally originally launched:

So net net, markets have gone precisely nowhere in the past 13 months.
But pay close attention here, context matters. Note in the chart above there’s a potential double top on $SPX. It may become invalidated next week as markets can once again look forward to a now dovish US central bank, although failure to strongly signal an end to QT may lead to disappointment now that the expectation has been set.
For now note that the January rally continues to follow the roadmap outlined back in December:

This roadmap suggested the counter rally peaking by the end of January followed by new lows to come. That is if the bear script is playing out, meaning a steep counter rally from below the 200MA peaking near or at the 200MA before turning and producing new lows:
That was the case in 2001 and 2008.
The potential remains. After all profound market fear has been replaced by re-emerging greed, in just one month:
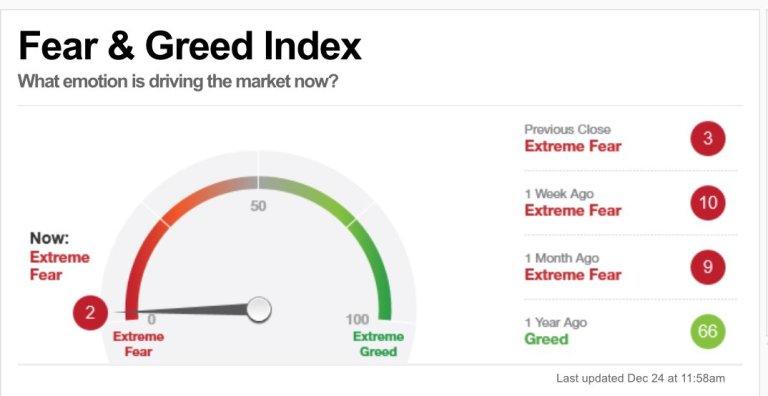
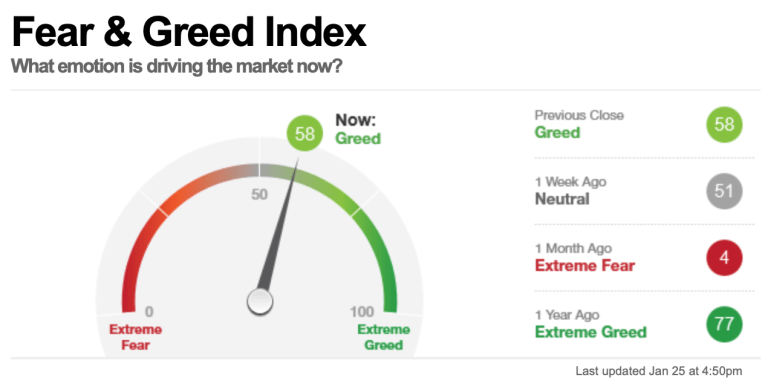
Nothing like price to change sentiment.
And no, markets are no longer oversold, they are pushing overtly against overbought readings and resistance.
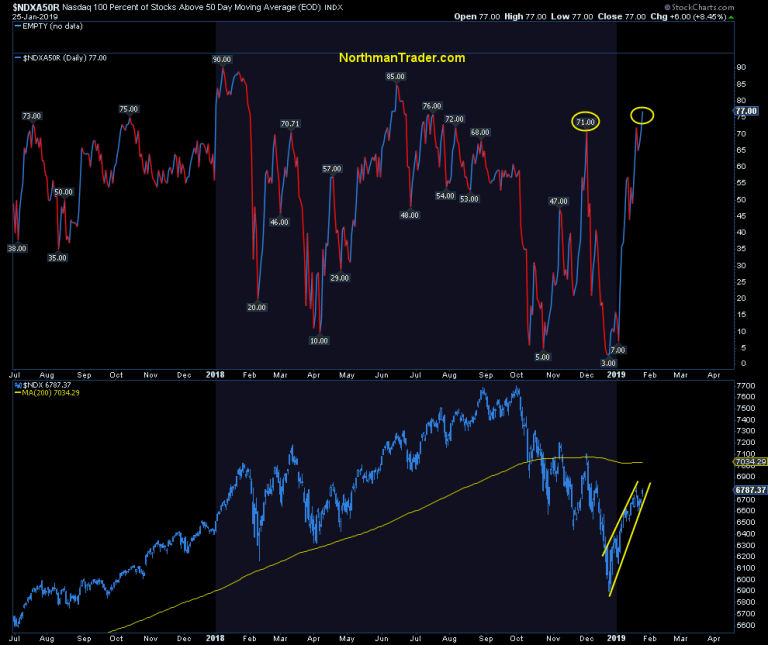
Take the $NDX as an example:
Components above their 50MA are back to summer higher readings while the $NDX remains below the 200MA:
And speaking of the 200MA, the recovery still hasn’t been truly tested. Past extreme reading recoveries have produced retests or new lows:
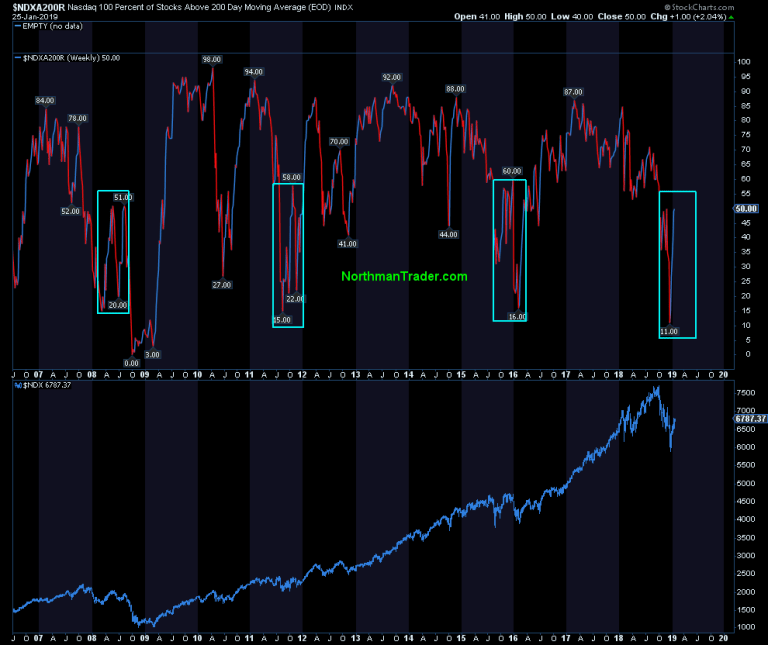
And hence the case for a test coming soon remains.
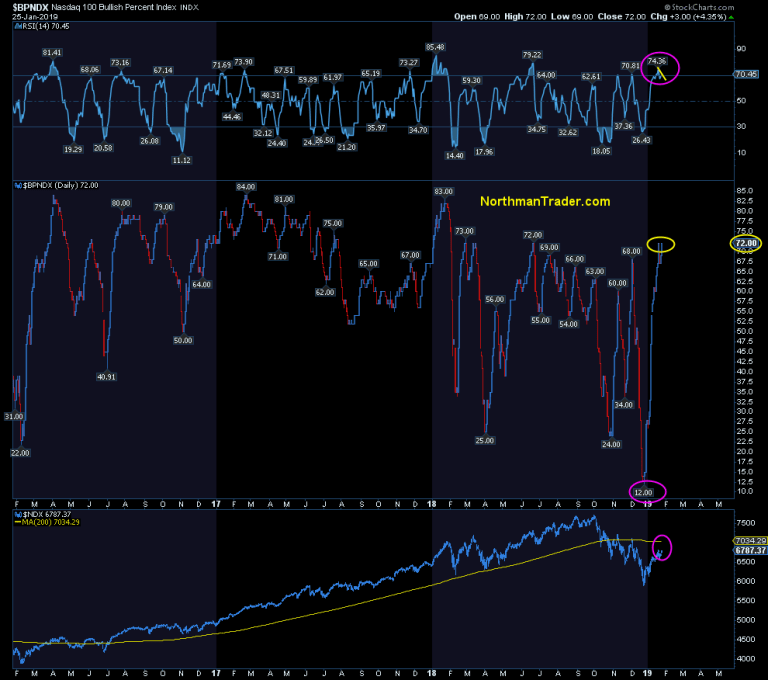
$BPNDX printed a slight negative divergence on its overbought RSI:
…while new highs/new lows couldn’t register any substantial progress as of yet:
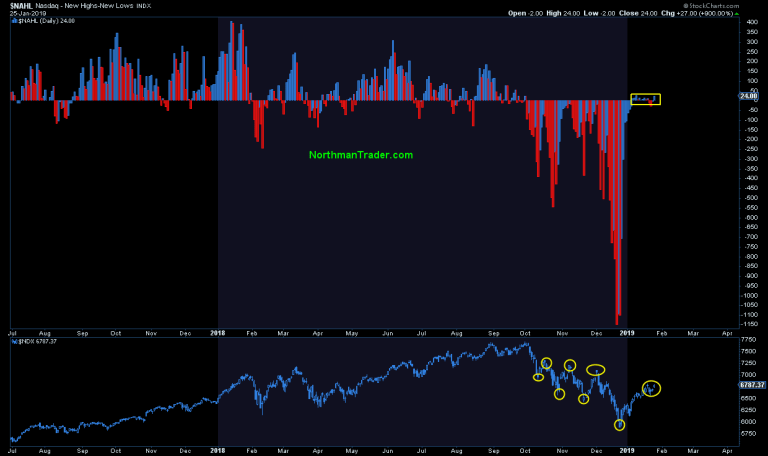
Like indices these indicators remain in the neutral zone, recovered from the depths of hell, but showing no confirmation of true positivity.
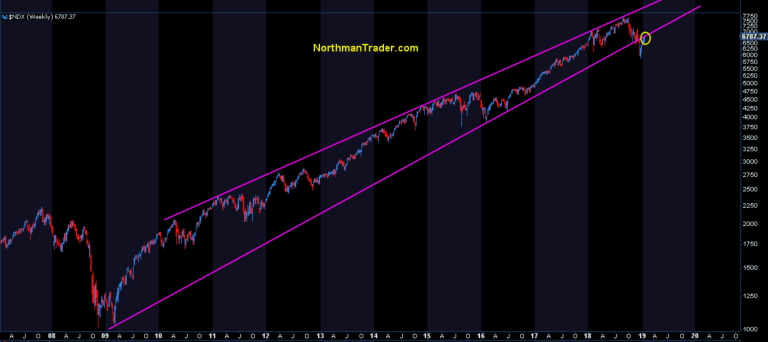
The pullback last week and current pause in equity prices is not only explained by overbought readings, but by proximity of key resistance on a number of index charts:
A key trend line on $NDX:
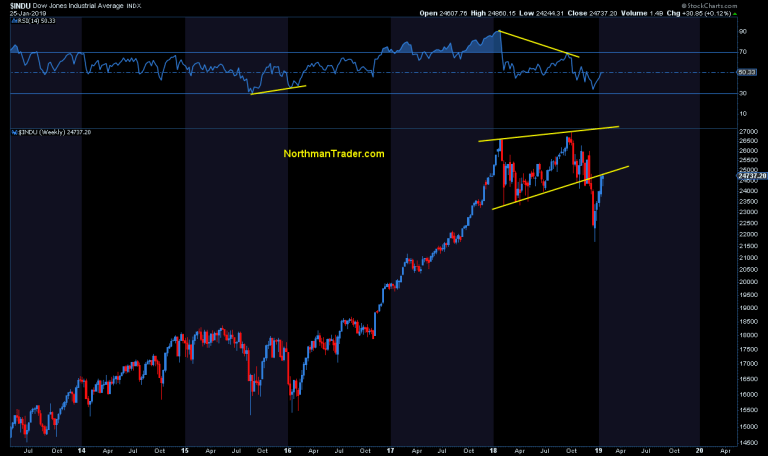
A key trend line on $DJIA:
A key trend line on $SPX:
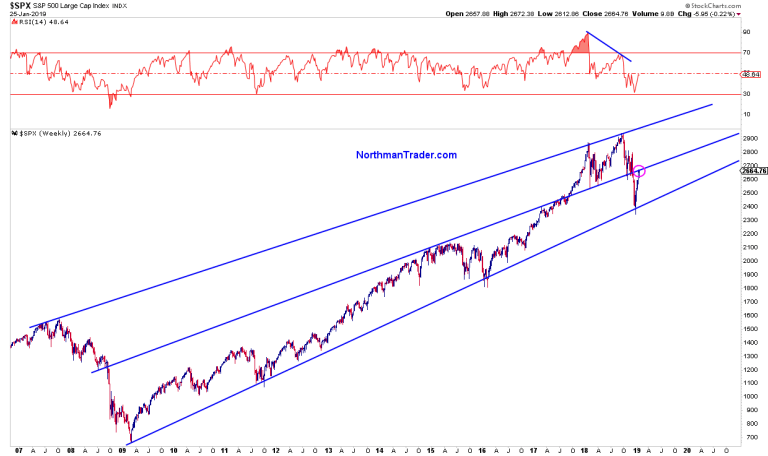
A key MA on $SPX:
And RSI levels have reached technical resistance while $VIX has reached support:

All of this is happening in context of asset managers having bought back in:
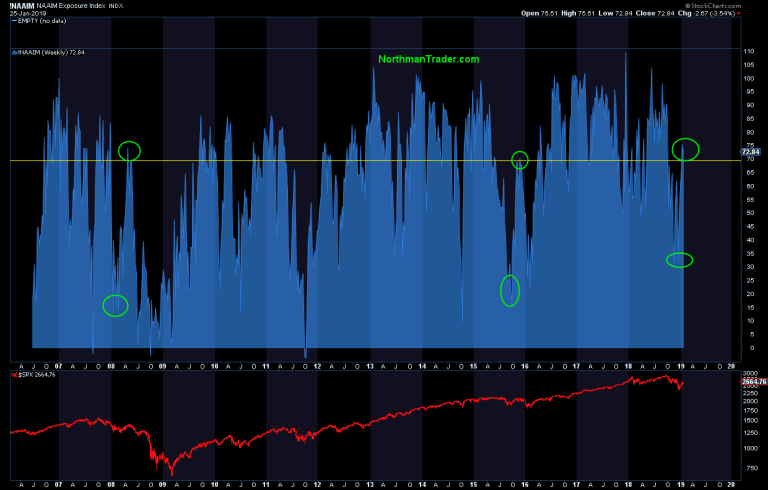
These type of reflexive re-allocations have been subject to retests in the past and hence are not to necessarily be taken as an all clear signal.
For now bulls can take comfort in the fact that 50MA tests offered support last week, see $RUT as an example:
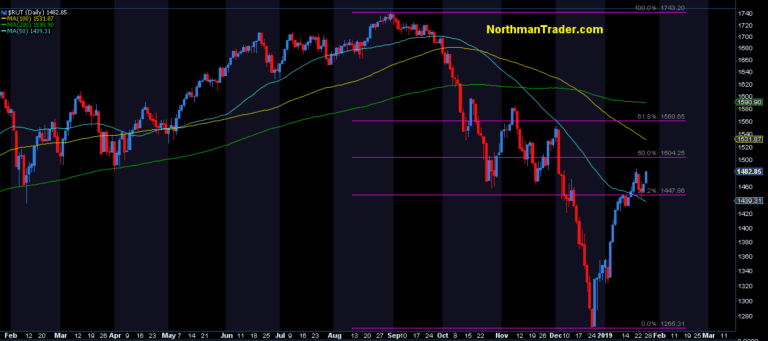
And as long as these hold as support there remains technical room and historical precedence to see prices pushing into the upper end of the risk zone outlined in early January:
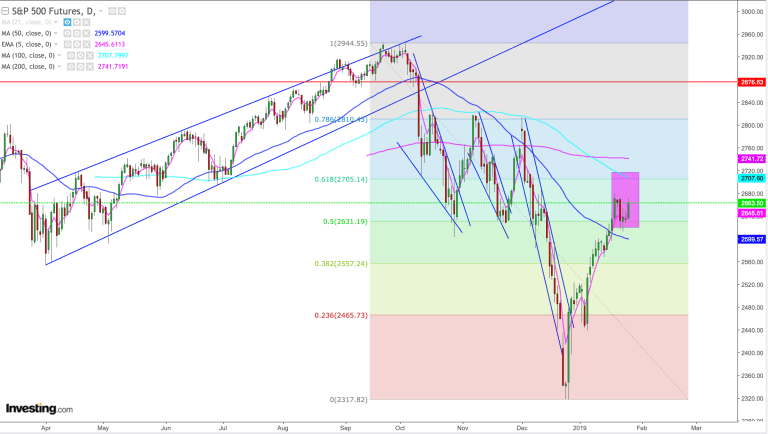
Simply put: A break below the 50MA opens the potential path to a technical retrace of size, a full retrace or new low altogether (to be determined and assessed then). Without such a break (and the 2600 area being support on $ES) risk remains into the .618 fib, the 100MA and the even the 200MA. The bull case remains unconfirmed until a confirmed break above and successful retest of the 200MA.
Immediate risk for buyers is a potential double top printed on Friday. Also of note: If new highs were to be made from here they would print negative’s divergences in overbought conditions, risking a sizable reversal:
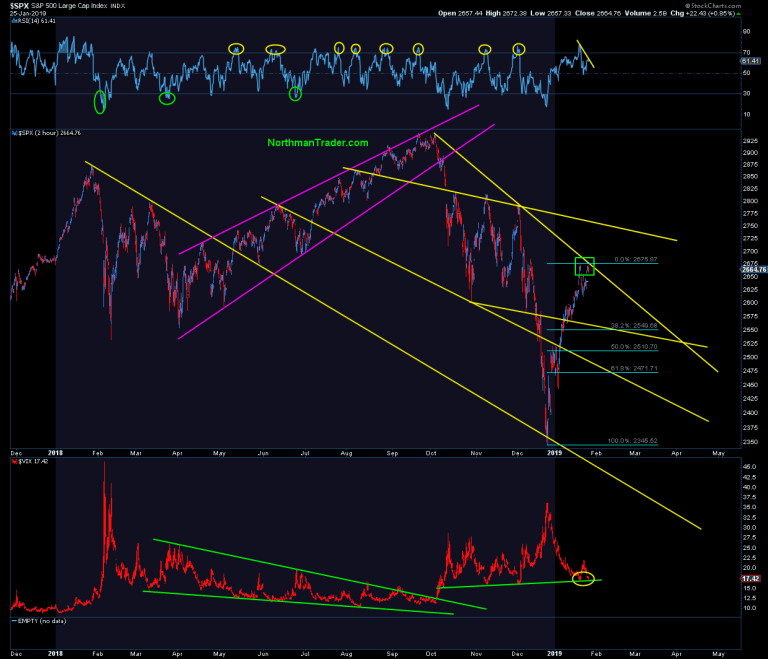
$SPX is stuck inside the neutral zone between the 50MA and the 200MA.
Watch out for those torpedoes…

* * *
For the latest public analysis please visit NorthmanTrader. To subscribe to our market products please visit Services.
via ZeroHedge News http://bit.ly/2B0FaKj Tyler Durden