As we noted yesterday, just ahead of the FOMC decision which consensus overwhelmingly expected would be “disappointing” as there was just “no way” the Fed could match the market’s dovishness (which it did, and then some), Nomura’s Charlie McElligott warned that “there is some VERY provocative, 11th hour talk through the ‘consultant/macro advisory’ circles that the Fed could state today that at a future meeting, they will lay out an actual timetable to end the balance-sheet runoff“, which would be seen by the market as a clear escalation of the thoughts trial-ballooned in the WSJ piece last week (to end QT “sooner-than-expected”)”, and the result would be wholesale panic buying response to this dovish reversal by the Fed which could send the S&P as high as 2,700-2,750.
Well, one day later, we are well on our way there, because as McElligott summarizes in his morning note, “here we are: The Fed (over the course of a month and half) goes laughably “all-in” on the slowdown story (because Equities prices now set policy I guess and not the other way around—but that’s none of my business), and markets respond with the old-school “QE trade” of old: Stocks, Bonds and Gold UP, US Dollar DOWN.”
As the Nomura strategist elaborates, not only did the Fed nuke the prior “…further gradual increases” guidance, but they actually said the next policy move is as likely “down” as it is “up”—all while “giving-in” to the market on an earlier-end to the balance-sheet run-off than previously expected.
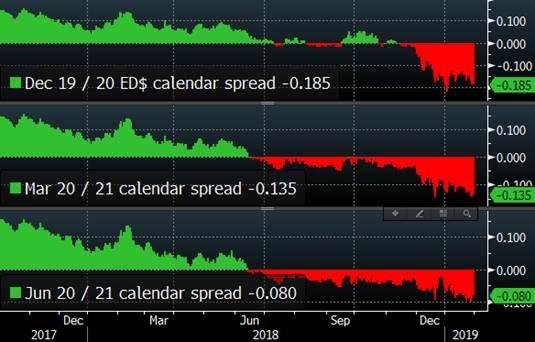
Predictably, the Fed’s complete capitulation to the market has mutilated “tightening” expectations, and as McElligott notes STIRs no longer simply price-in a “pause,” but instead the outright end of Fed policy rate normalization, with nearly a full rate cut again being priced for 2020 as shown in the Eurodollar spreads below.
All of this gave a powerful boost to stocks overnight and this morning, when after an initial weakness, the S&P is now at session highs, and above to rise above 2,700 and fast approaching it prior all time highs in the mid-2,800 area, even though more than one analyst have lamented that by caving to the market’s whims, the Fed has “traded short-term market support for more volatility this year” as Barclays said, or as Rabobank forecast, “epic market volatility is assured.”
Validating such concerns, one of the notable side effects of the Fed’s announcement was a sharp steepening in the yield curve, which as we discussed over the weekend is troubling, as it is a curve steepening – not flattening – that immediately precedes every recession…
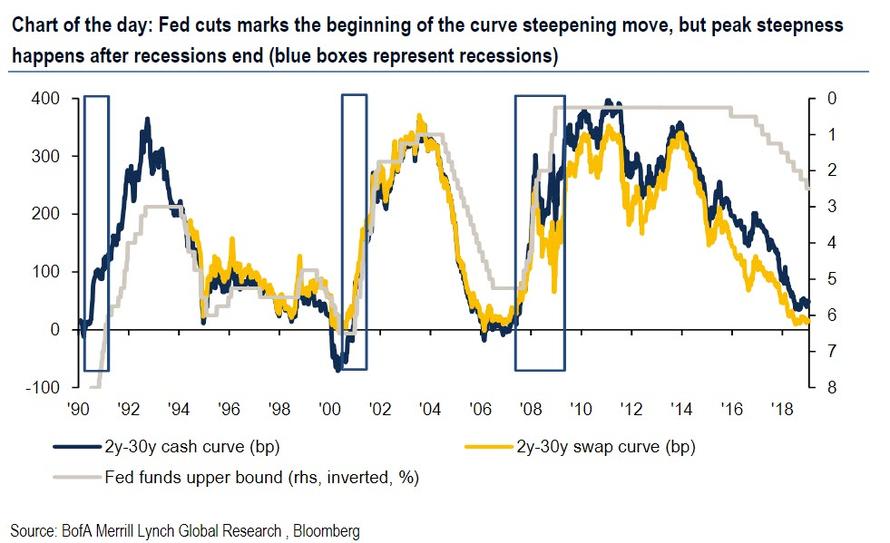
… and is also the reason why the most popular pre-recession trade according to BofA right now is a 2Y forward curve steepener.
Furthermore, as we discussed in our post why the Fed is now trapped, the last three recessions all took place with 3 months of the first rate cut after a hiking cycle, perhaps as it was the Fed’s official admission of economic weakness – by cutting rates – that triggered the economic contraction that was gathering pace as a result of higher rates and tighter financial conditions. “If that is indeed the case, then the next US recession will begin just a few months after the Fed cuts rates”, we concluded.
To be sure, McElligott also noted this curve move, warning that of the steepening of the yield curve at this juncture is 1) the precursor to the death of the cycle and 2) the signal that “we have tightened ourselves (through policy- and self-fulfilling anticipation-) into a slowdown / recession.”
Yet while the Fed’s capitulation, and eventual rate cut, may indeed be a precursor to a recession in 2020, and further market weakness, that would represent the long-term, ‘structural’, 12-month view. Meanwhile, the Nomura strategist notes that there are absolutely local “upside catalysts” for U.S. Equities.
This means that as traders contemplate how to trade in response to the Fed, there are two trades they need to consider: the structural, long-term one, and a more directional, tactical trade.
First, focusing on the structural one, McElligott lays out his “favorite 12 month trade” view post the Fed as follows: “The dovish bull-steepening capitulation (and impact on USD and U.S. Real Yields) then crystalizes the thesis for many of my previously-noted favorite 2019 trades:”
- The steepening is the longer-term catalyst for U.S. Equities “Value” factor market-neutral as funds rebalance portfolios into the “end of cycle / start of next cycle” trade (long “Value,“ short “Growth” as steeper curve “bleeds” the prior funding-advantage of now-EXPENSIVE Growth companies in a flattening curve environment, and further down-the-road as we approach easing, we see “Value Longs” work, which are economically-sensitive / very Cyclical which respond to easier FCI)—also worth again noting that the steepening too is a powerful headwind for “Momentum” factor as well
- The curve steepening is the core then to my favorite risk-book hedge, 1Y expiry 5s30s curve cap options contingent with SPX lower (we have this flow, and doing it contingent with SPX cuts the price in half)
- The dovish capitulation is driving a massive move lower in U.S. Real Yields and U.S. Dollar, which means another impulse higher for Gold
- For the same “lower USD / lower real U.S. Real Yields” catalysts, we are SUPER bulled-up on market-neutral (+) EEM / (-) SPY expression on the EM / DM convergence trade
- A similar (but even “saucier”) thesis with additional “High Beta-” and “Value / Growth-” kickers is (+) FXI / (-) QQQ
However, before one puts on these various directional trades, as Charlie puts it “Let’s be real though” noting that for Powell to have so utterly “bent the knee” to the stock market in such abysmal fashion absolutely changes the calculus for investor psychology near-term—and as such, traders have to again expect fundamental/active folks get “pulled-in” over the next few weeks, with “don’t fight the Fed” being the mantra against still very historically low “Betas to Equities” and “Nets-/Grosses-“
Additionally, in addition to the FOMO factor from institutions most of whom have been strangely missing from the recent ramp higher in risk assets, coupled with the end of the buyback blackout window which slowly rolls off after the end of this week once the majority of S&P companies report earnings, McElligott notes that there is a potential additional “Bullish Equities” catalyst which he mentioned last week regarding Systematic Fund flows and the importance of the 1Y model window, to wit:
Within the Nomura QIS CTA model, the 1Y window across all of Equities estimates is an extraordinary 86% weighting (meaning the longest-term window has an outsized importance over 2s / 1m /3m / 6m combined)
And as we laid out last week, here is why that matters: the violent sell-off days from early February 2018 are now about to “drop out of sample”—at least temporarily — which is likely to then move the next “buy to cover” level for existing Equities “Short” positions moves MASSIVELY lower, mechanically covering the remaining short and going long. So, in light of the these days dropping-out and the Fed-induced “gap,” the Nomura strategist expects these “cover short” levels to drop to a point where the 1Y signals are almost certain to mechanically signal flip from current “SHORT” to outright “LONG.”
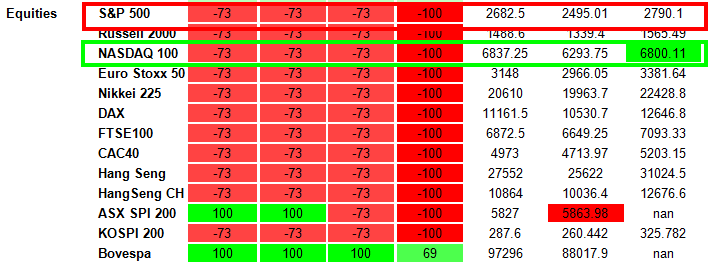
And as such, today Nomura sees its Nasdaq model likely pivoting from current “-71% Short” to an outright “+100% Max Long” signal by the close at current levels, as the 1Y model flips with powerful negative days coming “out” of the lookback, in conjunction with the overall Nasdaq return profile over the 1Y—all assumptions/current levels held constant, Nomura sees the 1Y Nasdaq model ‘flip to LONG’ and HOLDING as such over the following few weeks.
It’s not just the Nasdaq that is being supported by CTAs: should the S&P hold around the current level of around 2,700 it is likely that Tuesday we will also see a mechanical flip in SPX 1Y window from “short to long” as well:
Finally, from a ‘relative 1Y returns’ perspective (NDX +6.4% since last Jan vs SPX only +0.3%), it remains to be seen if an S&P “flip” (as opposed to Nasdaq definitely “going long” by the close) will in-fact be traded by the funds, especially due to the chop of the daily returns at the front of the 260d look-back period, McElligott cautions that it is just as likely to see the 1Y model pivot back “Short” with ensuing rallies (Feb 2nd SPX -2.3% Feb 5th -5.4% Feb 6th +3.3% Feb 7th -1.0% Feb 8th -2.8% Feb 9th +0.9% Feb 12th +1.4% etc as this volatility persists throughout the month + thereafter).
In other words, unlike the Nasdaq “100% long”, any imminent short-term flip “long” in the S&P signal as it currently stands looks to be a temporary “false signal,” as it will thereafter turn “sell” again due to the large snap-back days after the initial impulse lower from Feb 2nd / 5th.
via ZeroHedge News http://bit.ly/2S53BAY Tyler Durden