US individual income tax rates have become an important topic of debate in American politics, with both members of the new Democrat-controlled House and presidential hopefuls pitching changes to the status quo. There is, for example, talk of a 70% marginal tax rate for income above $10 million. One recent survey even showed the majority of Americans favor that idea, so there seems to be plenty of political air cover for a rethink of Federal income taxes.
Since this is the Data section, let’s look at 2 sets of numbers that should inform US tax policy.
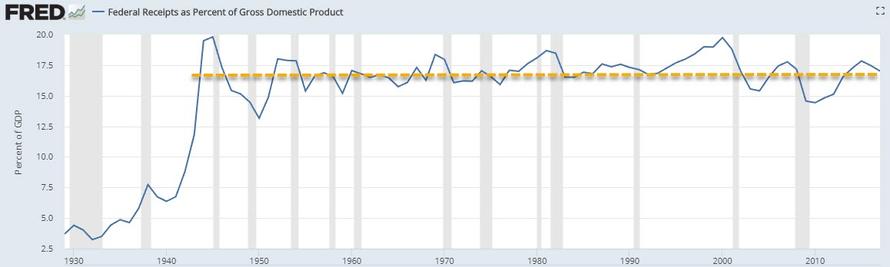
Point #1: The history of Federal tax receipts as a percent of US GDP. This measures how various US individual/corporate tax regimes have altered the ability of the Federal government to increase revenue relative to the size of the US economy. A few points here:
- Even though the highest marginal individual/corporate tax rates have varied widely since World War II (from 50% – 90% in the 1940s/1950s to 21% – 37% now), total tax receipts as a percent of GDP have been remarkably stable.
- The average tax receipt/GDP ratio from 1968 to 2017 is 17.1%. Every dollar of GDP creates 17 cents of Federal individual/corporate taxes.
- This ratio was 17.0% in 2017 (latest data available). The current cycle peak was 17.8% in 2015.
- History shows that economic growth does far more to increase tax collection than changes in the tax code. The post-World War II high for tax collections/GDP was in 2000, at 19.8%. The low water mark was 14.4% in 2010.
- You can see the data in chart form here: https://fred.stlouisfed.org/series/FYFRGDA188S
The upshot here: tax rates ebb and flow, but the historical record shows they don’t fundamentally shift the amount of money collected by the Federal government relative to the total “pie” that is the US economy.

Point #2: The number of US households making over $10 million/year in income, the most commonly mentioned threshold in the current political debate over “taxing the super rich”. Data on this cohort from the 2016 tax year (latest available at a sufficiently granular level), according to the US Internal Revenue Service:
- In 2016, the IRS received 16,087 returns that reported $10 million or more in adjusted gross income. That amounts to 0.01% of all returns filed.
- This group paid just over $116 billion in Federal taxes, or 7.9% of total individual tax collections for the 2016 tax year.
- Also worth noting: households making $100,000 – $1,000,000 in adjusted gross income are responsible for 53% of all Federal individual income tax receipts.
Those making below $50,000/year comprise only 3.9% of the same aggregate total. That’s not to say those households do not pay taxes, because we’re only talking about Federal income tax – not sales taxes, real estate taxes, etc.
- You can see the data here under “Tax Generated”: https://www.irs.gov/statistics/soi-tax-stats-individual-statistical-tables-by-tax-rate-and-income-percentile
The upshot on this point: those 16,000 households currently in policymakers’ crosshairs are going to be a very difficult target to hit. First, they have access to world-class financial planning that will develop tax-reduction strategies to fit whatever changes to the tax code that may come along. Second, there aren’t very many of them, so losing just 20-30% of them will dramatically impact tax collection. For example: to the degree that some are foreign nationals, they can move to new jurisdictions with more favorable tax regimes.
The real issue:
…once taxing the +$10 million earners at higher rates fails (a rational expectation given the prior points), the burden for any incremental social spending will quickly move down the income ladder to the $100,000 – $1,000,000 brackets.
That, the data clearly shows, is where income tax collection is most effective. This group is large (+25 million households) but does not have the same access to tax-minimization strategies as the +$10 million cohort.

They, not the “super rich”, will end up with higher actual taxes.
via ZeroHedge News http://bit.ly/2RZ5sHc Tyler Durden