Submitted by Nicolas Colas of DataTrek Research
Asset price correlations remain elevated for global equity markets as well as US industry sectors. That highlights just how much stocks have become a one-decision asset class as we wait for news on US/China trade. Watch Tech and Industrials – the 2 most correlated sectors to the overall US equity market just now – for early signs on investor confidence that a deal is really forthcoming. And don’t expect volatility to decline any time soon…
“Analysts – in a bull market you don’t need them and in a bear market they’ll kill you.” That is one of Wall Street’s oldest sayings, and anyone who has run money for longer than a hot second will be nodding their head in agreement just now. The logic behind it: when things are working it’s easy to find the leadership groups and when they aren’t it’s better to be in cash.
In the end, however, this old saw is more about correlations than bull-bear equity markets. The degree to which asset price moves simply mirror each other varies through a cycle. At the bottom, they cluster together like scared sheep. As economic and market conditions improve, they begin to go their own way. At the top, they each move to their own distinct rhythms. Then the next downturn hits, and the cycle repeats.
That is why we look at asset price correlations every month; they are a useful signal of market psychology.
Based on the most recent data, here are 5 points on the topic:
#1. Thirty-day correlations for US equities, EAFE (non-US developed economies) and Emerging Market stocks remain quite high.
- The correlation between the S&P 500 and EAFE sits at 0.87, higher than all but 3 US industry sectors (more on those in a minute).
- The correlation between the S&P and Emerging Market equities is 0.79, and hasn’t budged all year.
- The r-squares for each (76% for EAFE, 62% for EM) remain well above 50% despite varying economic conditions around the world.
What this means: global equities are all trying to price the same question. “When will the US and China come to a trade agreement, and will it be enough to reignite global economic growth?” Even as US stocks were the clear winner over the last month (+4.2% vs. +3.2% for EM and +1.4% for EAFE), day-to-day price action is moving largely in lock step.
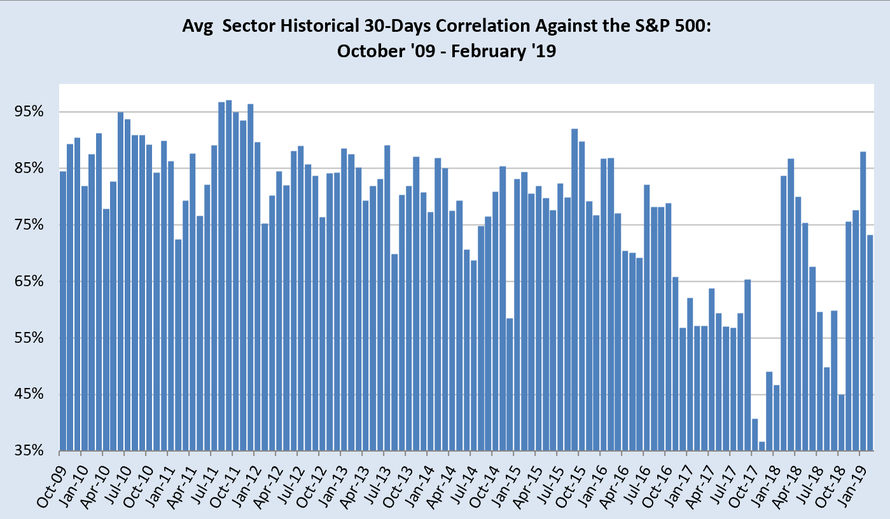
#2. Average US sector correlations are, however, beginning to decline.
- The mean correlation to the S&P 500 for the 11 sectors of the index was 0.73 over the last month.
- That is down from 0.88 last month and 0.78 the month before.
- We’re still well above the average for last year (0.67) and the lows of 2018 (0.50 in August).
What this means: the 2019 YTD rally still looks and feels more like a synchronized bounce from December’s oversold conditions than a fundamentally bullish rethink of equity valuations. We have the monthly sector data back to 2009, and current higher-than-average correlations look very close to the 2010 – 2015 data. That’s not a bad thing; it just means that we’re not yet back to a place where investors are treating sectors as distinct groups.
#3. High sector correlations help explain why the CBOE VIX “Fear Index” remains stubbornly above 15, even as US stocks have posted good YTD results.
- Since 2009, the correlation between the VIX and average US sector correlations is 0.67 – when correlations rise, so does the VIX.
- There’s a good reason for that – lower correlations mean better diversification by sector within the S&P 500 index. And, therefore, less volatility.
What this means: as long as sector correlations stay high (and we think that will run for a while given point #1 above), so will the VIX. This does not mean the VIX is “broken”.
#4. Technology and Industrials are the two key S&P sectors to watch.
- Correlation between large cap Tech and the S&P 500: 0.94, the highest of any group over the past 30 days.
- The same number for Industrials: 0.91, the second highest.
- Both Industrials (+8.2 for the month) and Tech (+6.1%) have outperformed the S&P (+4.3%), besting other heavyweight sectors like Health Care (+2.3%), Financials (+5.1%), and Consumer Discretionary (+2.6%).
What this means: it is another proof-point that the US equity narrative is locked in the tractor beam of US/China trade negotiations and their effect on global trade/economic growth. Tech has the highest percentage of non-US sales of any sector (57%). Industrials have less (36%, close to the S&P average of 37%), but do have high fixed cost bases so tariffs/slower global growth hit them disproportionately hard.
#5. Outside of equities, one asset class is similarly tied to how the S&P 500 trades: US corporate high yield bonds.
- Thirty-day correlations here are 0.76, higher than the average S&P sector.
- When markets are truly frothy (think middle of last year), high yield correlations can drop to 0.54 – 0.56.
What this means: you can get diversification to a US equity portfolio with investment grade corporates (0.12 correlation), long-dated Treasuries (-0.63) or even gold (-0.39). But not from high yield…
Final thought on all this: we’re as close to a one-decision capital market as we’ve seen the early days of Federal Reserve bond buying. Here’s how it looks:
- Scenario #1: If the US and China come to a meaningful trade agreement soon, investors will start to discount its positive impact with more scrutiny on geographic/sector/asset class exposures and correlations will decline.
- Scenario #2: If that trade agreement is wishy-washy or fails to materialize, then investors will assume a global recession is inevitable. Risk asset prices will fall, all at once, and correlations will rise.
via ZeroHedge News http://bit.ly/2N5uy1i Tyler Durden