Last week, Nomura’s cross-asset strategist Charlie McElligott who correctly predicted the aggressive steepening in the yield curve observed in recent weeks as traders embraced a late-cycle reflation trade, and who has been pounding the table on a (violent) rotation out of growth and into value stocks, laid out a sequence of events that would lead the market to the “long awaited” selloff (incidentally, a true selloff, not the gentle turbulence observed on Monday).
Now, there is one even more bearish technical catalyst to consider.
As McElligott writes in his latest note, referring to the dynamic he has been discussing recently in terms of the CTA Trend model’s US Equities extremely over-weighted 1Y window (where 90% of the overall model signal input across the five horizons), the window of “mechanical” sell-trigger levels for the trend-following community, is “kicking-off” in the coming-days—and thus moves us closer to triggering systematic trend fund “deleveraging” looking-out. The timing would coincide with his prior “Ides of March” warning, and would strike in about two weeks, coinciding with the March Op-Ex pullback phenomenon, and commencement of corporate “buyback blackout” at same time.
As a reminder, Nomura’s current CTA position estimates are “+100% Max Long” almost uniformly across the board (including SPX, RTY, NDX, EuroStoxx 50, Nikkei 225, FTSE100< CAC40, Hang Seng, Hang Seng CH and ASX), and only the DAX and Kospi still see CTAs net short.
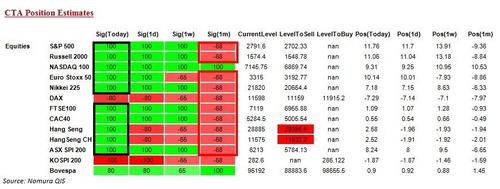
It also goes without saying that US Equities remain the global “risk-asset bellwether,” so any potential inflection points are critical to watch-for specifically with SPX, NDX and RTY.
The punchline, however, is that although current levels to hold the “Max Long” remain well-above any deleveraging/sell-triggers, according to McElligott, over the coming weeks those “breakpoints” at which the 1Y model would flip to a sell signal are moving higher, closer to where the S&P and other major equity indexes are trading now.
So where are these upcoming trigger points?
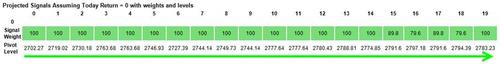
As shown in the chart below, over the next week Nomura expects the CTA “sell level” to move up nearly 50 handles, and over the next two to three weeks, expects to see the “sell level” leap a very significant 90 handles CLOSER to “at the market” — which means that the market is at risk of seeing a very leveraged strategy turning a NET SELLER if we were to see those catalysts I’ve discussed over the past two weeks (see my “IDES OF MARCH” piece) dictate even just a smallish pullback in index.
Here is another way of saying it, conveniently as stated by McElligott in all caps:
S&P “SELL TRIGGER” BEING PULLED MEANINGFULLY HIGHER IN THE COMING WEEKS, MEANING A GREATER ‘DELEVERAGING’ RISK FROM SYSTEMATIC CTA’S INTO THE POST- MARCH OP-EX SEASONAL PULLBACK PHENOMENON AND THE COMMENCMENT OF THE CORPORATE “BUYBACK BLACKOUT,” WITH ESH9 AT 2795 LAST THIS MORNING (as a reminder, these levels are not static and will change daily with new price- and realized vol- inputs):
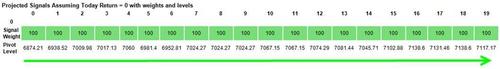
A similar staggered increase in the Nasdaq trigger points is shown in the next chart:
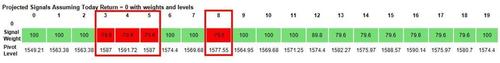
Finally, here is the Russell, with the RUT future last trading at 1576.
via ZeroHedge News https://ift.tt/2H4OgdA Tyler Durden