One can’t say they didn’t warn you:
- On December 23, with the S&P points away from a bear market, Steve Mnuchin called the Plunge Protection Team, i.e. President’s Working Group on capital markets, with one clear message – stop the plunge.
- On December 25, Trump pulled an Obama, and told Americans to buy stocks: “We have companies, the greatest in the world, and they’re doing really well,” the president told reporters at the White House on Christmas Day. “They have record kinds of numbers. So I think it’s a tremendous opportunity to buy. Really a great opportunity to buy.” (Pension funds heard him loud and clear, unleashing the biggest stock buying spree in history the very next day).
- On January 4, just two weeks after Fed Chair Powell hiked rates by 25bps and said the Fed’s balance sheet was on “autopilot”, and tightening would continue, the former Carlyle lawyer, sitting between Bernanke and Yellen capitulated, and for the first time said that the Fed would be patient, effectively ending the Fed’s rate hike posture.
What transpired since then is nothing short of breathtaking, with the S&P rebounding from the mid-2,300 to 2,800 (a level it has so far failed to breach decisively) in what Goldman last week dubbed “one of the sharpest rallies in history.” Indeed, as shown below, the rolling 67-day price return of the S&P is the 3rd fastest rally this century, perhaps ever. In other words, there are bear market rallies and then there are bear market rallies, and what we have just experienced was, according to Goldman, “the sharpest rally since the global financial crisis recovery, and sharp valuation re-rating alongside negative earnings revisions”…
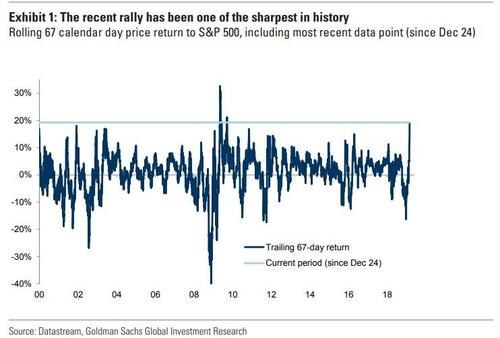
… one which was accompanied by one of the largest declines in realized vol since 1928.

Now, thanks to Bank of America, we present yet another perspective on what has effectively been a bear market rally – because even though the S&P closed -19.8% from its Sept 20 all time highs on Dec 24, it did dip below the critical -20% level intraday.
According to BofA’s equity derivative research team headed by Benjamin Bowler, in the 50 days since the bottom of the Q4 selloff (when SPX dropped 19.8% from peak to trough on 24-Dec), the S&P has recovered 16.7% and is still about 6.4% below the last peak. To BofA, this – as Goldman first noted last week – “is indeed a sharp recovery, and the rebound is faster than other “draw ups” following similar-sized selloffs.”
Putting the move in context, BofA plotted the path of SPX recoveries from the 5 historical drawdowns of ~20% since 1928 (the last three months have come following a 19.8% drawdown on a closing basis). After 50 days, the SPX was ~10.7% from the last peak on average (compared to 6.4% today). In comparison, the fastest recovery was from the Aug-98 trough (was only 4.3% below the peak after 50 days and fully recovered in 60 days) while the slowest was from the Oct-57 trough (was still 18.2% below the peak after 50 days and didn’t fully recover for 223 days).
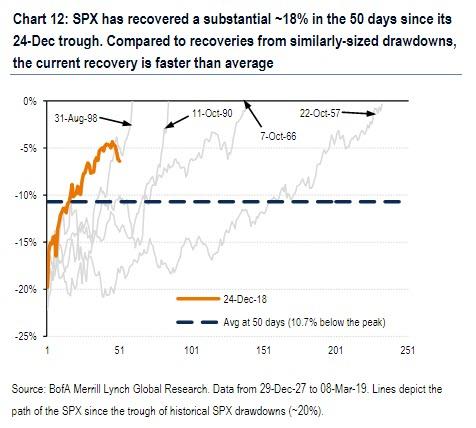
Interestingly, the Aug-98 event was one of the early scenarios when the Fed cut rates to fight market weakness. It is worth noting that while the Fed has not cut rates – yet – in the most recent bear market rally, the catalyst for the rally was the Fed’s reversal from a hawkish tightening bias to a dovish one, where the Fed said it would adjust the shrinking of its balance sheet and would be “patient” about future rate hikes. In other words, the two fastest bear market rebounds in history were both the result of direct Fed intervention. It goes without saying that while the 1998 rally persisted for several years, it eventually culminated in the dot com bubble and the first Fed-induced bubble burst.
How and when the current bear market rally (and bubble) ends, is still unknown.
via ZeroHedge News https://ift.tt/2XUo3U8 Tyler Durden