Via DataTrekResearch’s Nicholas Colas,
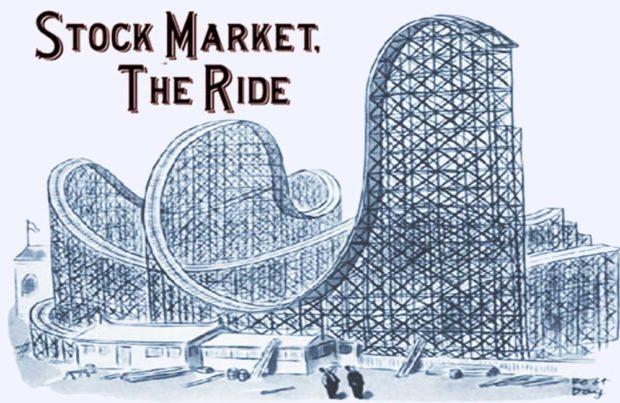
The last 20 years have been the toughest stretch for US stocks since the Great Depression into World War II. The next 5 years will either confirm investors’ worst fears that stocks are no longer “for the long term” or begin to re-instill confidence in the asset class.
The fulcrum issue: avoiding a +10% annual drawdown any time between now and the end of 2023.
Over the last 20 years US equity investors have seen the worst aggregate returns since the period that includes the Great Depression and World War II. We’ve covered this topic a few times before, but here is a quick reprise:
- The compounded annual growth rate (CAGR) for the S&P 500 from 1999 – 2018 is 5.6% on a total return basis. (Data courtesy of NYU professor Aswath Damodaran.)
- That is the lowest 20-year trailing return since the period ending 1950, which had a 3.7% CAGR.
- Adjusting for CPI inflation, 20-year trailing returns ending 2018 are 3.0%. The last time inflation-adjusted returns were lower than that was 1998, thanks primarily to the double-digit inflation of the 1970s.
In our view, the fact that 20-year S&P real returns are at +60 year lows explains more about the current market environment than any other single statistic. Capital moves to passive, low fee investment products when returns are this low, because every basis point of expenses matters. Rate-of-return-targeting capital (i.e. pension and sovereign wealth funds) shifts to riskier asset classes like venture capital and private equity in an attempt to juice portfolio returns. Everything from the dramatic growth of ETFs to SoftBank’s $100 billion VC fund ties right back to that paltry 5.6% long run return on the S&P 500.
Today we want to extend the discussion into the future: how will the next 5 years alter the long run return profile of US stocks? The idea here:
- The period from 2000 – 2003 saw a 37.4% decline for the S&P 500. The only similar-sized drawdowns since World War II occurred in 1973 – 1974 (-36.5%) and of course in 2008 (-36.6%).
- The next 5 years will finally see 2000 – 2003 anniversary out of the 20-year time series. The year 2008 will remain in the data, of course.
- While no specific time series can alter investor perceptions of long run return potential on its own, the next 5 years can either push the needle back towards historical averages (10-11%) or just confirm that US equities are locked in a volatile and low return “doom loop”.
The data shows that avoiding outsized declines over the next 60 months is the key to the story. Three scenarios to consider:
#1. Nothing great, but nothing awful either.
- Assume 2019 can post a 10% total return, simply by holding onto most of the current gains (+12%).
- After that, stocks appreciate by 5% annually due to modest earnings gains and stable interest rates. If there is a recession, it is very small and the Federal Reserve responds quickly enough to limit the damage on corporate earnings.
- Using these inputs, the 20-year trailing returns for the S&P would be 7.3% in 2023.
Net result: slow and steady gains may not match long run averages, but in a world of sub 3% Treasury yields seeing 5% total returns and 7% long run CAGRs might be enough to shift capital back to US equities from alternatives and fixed income.
#2. Bounce back this year, recession in 2020, slower growth thereafter:
- The same 10% gain in 2019 as the prior point, but a 15% decline in 2020 and then +5% returns from 2021 – 2023.
- The 20-year CAGR in 2023 under this scenario would be 6.1%, not far from the 5.6% ending 2018.
Net result: nothing really changes from the current environment. Five-year CAGR returns from 2019 – 2023 would be only 1.6%, and the long-run numbers would remain poor.
#3: The bears are right about the current market, which falters in 2019.This pushes the US into a recession in 2020, and the subsequent recovery is only anemic.
- The S&P declines by 15% in 2019, and a further 10% drop in 2020. After that, the S&P 500 compounds at 5% from 2021-2023.
- In this world, the 20-year CAGR falls to 5.1% in 2023, below the 2-decade period ending in 2018.
Net result: 5-year returns would be -2.4% and the long run data would continue to worsen.
The bottom line to all this: past is not prologue but it still informs asset allocation and investor perceptions of risk and return. The last 20 years, marked by 2 busts (2000-2003 and 2008), one half-hearted recovery (2004 – 2007) and one boom (2009 – present), has trained all of us to be wary of equities. The next five years will either harden that caution or begin to re-instill some long-term confidence in the asset class.
via ZeroHedge News https://ift.tt/2u8pTmO Tyler Durden

