The 2019 U-turn in the Fed’s monetary policy tightening cycle has contributed to one of the strongest declines in cross-asset vol in recent years. According to Bank of America’s Cross-Asset Hedging model, there has been a coordinated decrease in volatilities and credit spreads for two consecutive months, a phenomenon not seen since 2014. Separately, the fall in cross-asset vol is also the largest since Draghi’s July 2012 “do whatever it takes” comments. Indeed, as Goldman observed last week, the fall in S&P500 realized vol has been one of the largest since 1928.

This, to Bank of America, but really to anyone else, “is further evidence of the power central banks have in managing volatility in financial markets.”
However, as BofA’s Gonzalo Asis writes last week, what type of vol regime follows from here remains far from certain. After all, while a Fed pause has clearly been supportive of equity markets, the conditions that would drive the Fed to cut rates could be less positive for stocks especially since as we discussed recently, the last three recessions were all preceded by a rate cut three months prior. In fact, bond markets are already predicting the Fed will lower rates next year, including a 33% probability of a 25bp cut in Jan-20.

Assuming that is indeed the case, what does history tell us about the behavior of equity vol in the lead-up to a cut”
To answer this question, BofA looked at all major first cuts in Fed Funds since 1972. While changes in short-term rates serve as a good barometer of monetary policy, the means used by the Fed to pursue its mandate have varied over the years. For example, between 1979 and 1982, under Volcker’s leadership, the Fed used money supply as the main tool to tame inflation, letting short-term rates fluctuate more freely than in other periods. For those instances, BofA relied on historical archives to pinpoint dates of important changes in Fed policy. The chart below shows the resulting dates, which the bank used in its analysis of the relationship between Fed rate cuts and US equity vol.
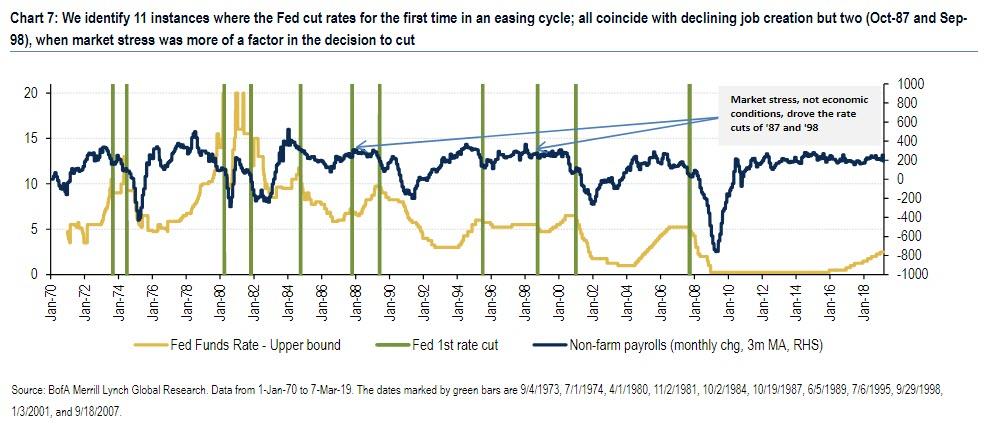
The chart also shows the 3m moving average of the monthly change in non-farm payrolls, a measure of job creation in the US and a common gauge of overall economic health. Not surprisingly, the majority of first cuts happened in an environment of falling job creation, which often continued long into the Fed’s easing cycle. However, there are two cases in which economic conditions didn’t seem to be a big driver of the decision to lower rates – Oct-87 (Black Monday) and Sep-98 (LTCM).
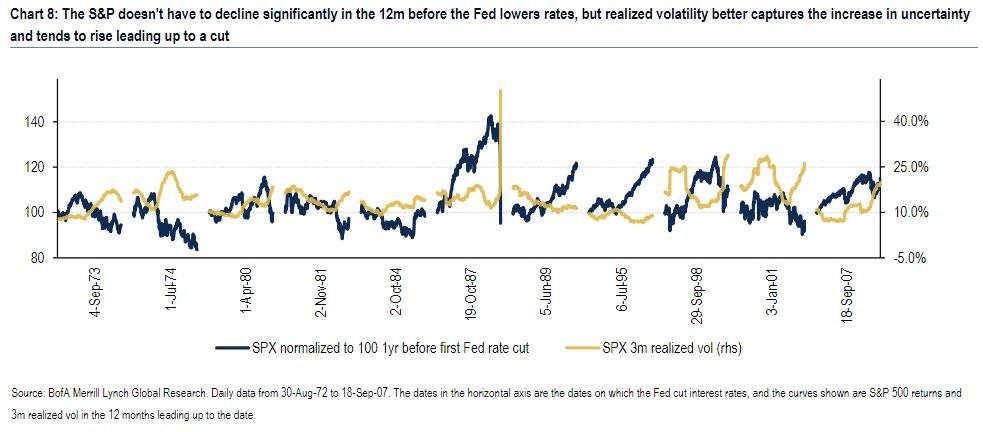
The next chart studies equity returns and volatility around all 11 episodes; in it BofA plots the S&P 500 and its 3-month realized volatility in the 12 months preceding each first rate cut. The first conclusion that stands out is that the S&P doesn’t have to decline severely before the Fed lowers interest rates. In fact, the index was flat or up 5 out of 11 times over the 12 months preceding the cut, and only in the first two periods were equities more than 5% down vs. a year prior. On the other hand, volatility does tend to capture the increase in uncertainty as the change in policy approaches, with 8 out of 11 periods experiencing an increase in vol. Interestingly, the two largest increases in vol occurred when a deteriorating US economy was not the main factor driving a rate cut – Oct-87 and Sep-98. Rather, a sharp spike in vol drove the decision to lower rates.
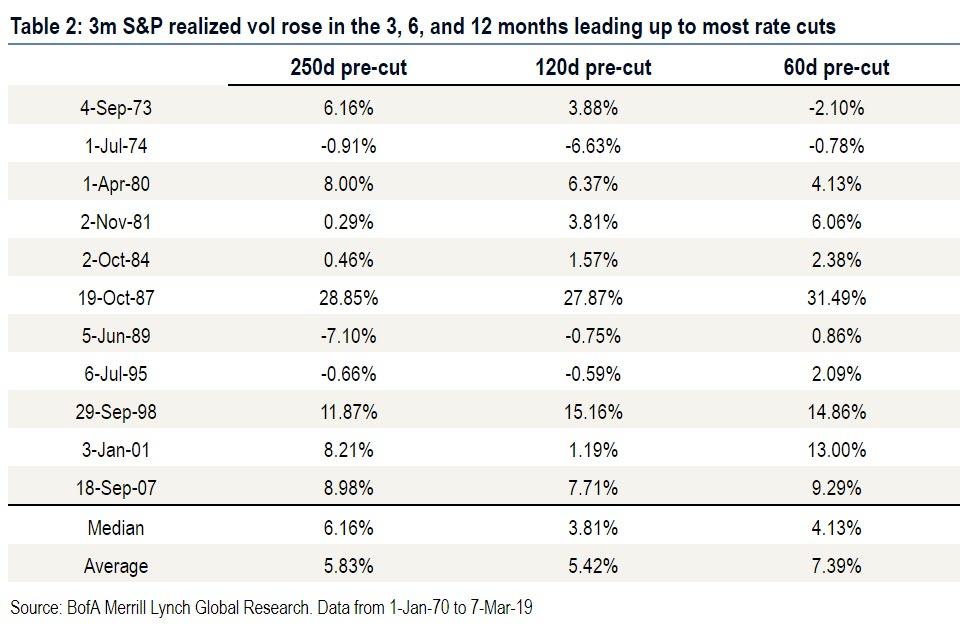
For all those who are blasting the Powell Fed for capitulation on hiking rates just because of the market swoon in the last quarter of 2018, it is worth noting that it was also market stress that triggered the ’87 and ’98 cuts, as well as the more reliable behavior of vol in anticipation of lower rates as the next two table show. Whether looking back 3, 6, or 12 months, the largest increases in 3m S&P realized vol across all 11 periods occurred in Oct-87 and Sep-98. But vol did rise consistently leading up to rate cuts, as only in 1974 did vol fall meaningfully in the 6 months prior (-6.63 vol pts), while in several cases it rose more than 5 vol pts. As a result, median and average vol increases were consistently positive when looking back 3, 6, and 12 months from the cut. This historical asymmetry in favor of higher vol suggests leaning long vol as a potential rate cut approaches, though one needs to be conscious of the cost of carry.
Here one can’t help but wonder if the inverse is also true: if the massive plunge in realized vol (as shown in the Goldman chart above), not only confirms that rate cuts are off the table, but that rate hikes may return soon (as Morgan Stanley suggested last week). If so, expect some fireworks from the Fed which will be forced to pull a second 180-degree U-turn within month.
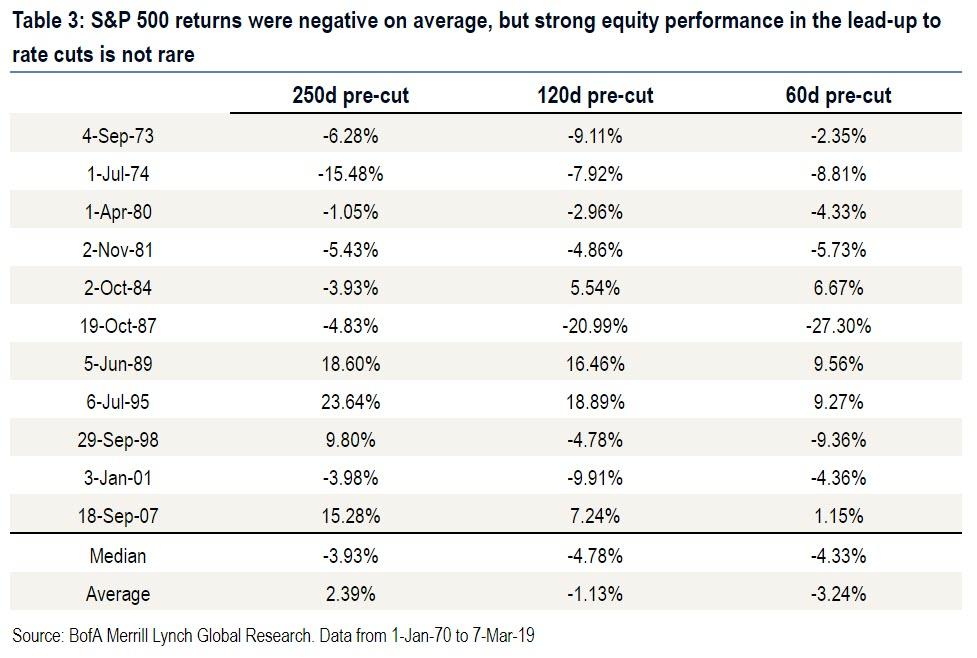
Volatility aside, there is a less clear trend in S&P returns around episodes where the Fed lowered rates for the first time in a cycle. While the median return was negative in all lookback periods, 4 out of 11 times the S&P was actually up on both a 3- and 6-month basis when the Fed cut rates. Again, the most extreme selloffs 60 days prior to the cut occurred in Oct-87 and Sep-98.
While aggregate summary stats point to higher vol as we move towards a potential rate cut, it is also worth considering whether one of the periods where vol fell would be a relevant analogue to today. Realized vol fell in the 6 months leading up to the cuts of Jul-74, Jun-89, and Jul-95, while it barely rose in Jan-01. However, according to BofA these periods in which vol fell are not appropriate analogues for today, as:
- In 1974, this decrease in vol happened towards the end of an 18-month, 48% drawdown, where vol reached local highs prior to the Fed intervening. While we saw some market weakness in Q4-18, it doesn’t compare to the depth of that selloff.
- In 1989, vol was still on the way down following the ’87 crash, also not comparable to today’s vol rising from record lows in 2017.
- In 1995, the Fed began a mild easing cycle seemingly in response to slowing growth and significant volatility in bond markets. Equity markets showed little concern leading up to the cut and, in fact, rose 50% in the 18 subsequent months, far from most people’s outlook for markets today.
- In Jan-01, the episode when vol rose the least in the preceding 6 months, realized vol was already in the mid-20s following the pop of the Tech bubble, limiting its response higher to the cut in rates.
Finally, looking at what the Fed Funds futures market was implying ahead of “first cuts” in interest rates since 1989, it seems that in most cases the rates market was in fact pricing in varying degrees of a hike, and was hence “surprised” by the cut. Even though this didn’t lead to a consistent response from volatility across episodes, one may still wonder whether a potential rise in volatility is less likely if markets accurately price the cut well in advance (as they may be doing today). and by extension, whether such market discounting may prevent the very event that is supposedly being priced in (i.e., not rate hikes until stocks slide again and vol surges).
As BofA concludes, while history doesn’t help us establish much precedent here, today’s low levels of recent S&P realized volatility (30-day is around 10 vol points) appear inconsistent with a rate-cutting environment, given that in only one instance out of 11 historically was realized volatility lower than it is today. All else equals, this suggests that all those who are convinced the Fed’s next act will be a rate cut in approximately 9 months may be in for a rude awakening.
via ZeroHedge News https://ift.tt/2u958Ye Tyler Durden