Authored by Mark Orsley via PrismFP,
-
US 5s30s, which has become widely consensus, is now at an inflection point
-
What could cause a short-term 5s30s correction?
-
Analysis of the correlation regime change in S&P vs. 5s30s
-
Despite near term correction risks, 5s30s remain the cyclical trade to do in 2019
Circling back after a few busy days of client meetings along with a really interesting macro dinner we hosted last week in NYC. By far the largest takeaway is how consensus the 5s30s steepener has become. I don’t think we found a client that is remotely interested in the flattener at this point, and at risk of being dramatic; the 5s30s steepener now appears to be the most consensus trade in the US.
The oft cited reasons for the steepener include the “end of cycle” and the Fed’s new “AIT” framework, both of which we have discussed enough at this point so will leave it at that.
This crowdedness is important because we are coming up on key technical levels that deserve flagging. To put it bluntly, the curve is now at an inflection point.
Recall the medium target for 5s30s has been the resistance level around 63bps. That is now very near and within the “close enough” zone. This also coincides with the RSI hitting overbought, and the completion of the 5th Elliott Wave. There should soon be an ABC correction lower. This correction is NOT the end of the steepener and in facts forms the right shoulder of a massive bullish inverse head and shoulder pattern. That makes the long-term target 105bps…
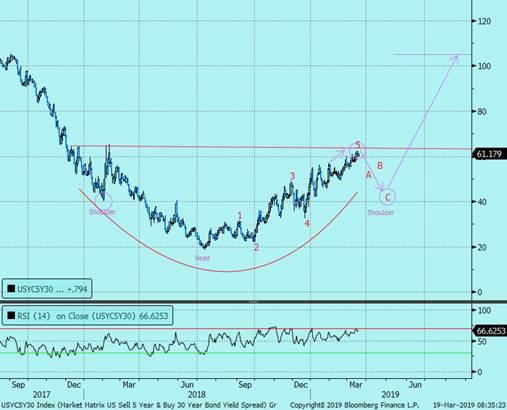
Therefore, at resistance, with the curve overbought, and the Elliott Wave count complete; there is decent scope for a near-term correction. However, to be clear, this would be just a temporary correction. All the long-term technicals remain very bullish.
Speaking of temporary corrections, with regards to the RSI, it is interesting to note that every time in the last few months of this bull run in the curve the RSI hits overbought; there is a correction a short-while later…
The question becomes what fundamentally could cause the pullback. Let’s go through some reasons:
1) Fed hikes – actual hikes are EXTREMELY improbable at this point. Please ignore Dudley who is not even in the Fed anymore and focus on the new core of Powell/Clarida/Williams. They have made their stance clear: “patience, downside risks, deterioration of inflation expectations.”
Perhaps more likely is the Fed leaves some hike expectations in the dot plot on Wednesday and that leads to a bit of curve weakness. It’s fair to say at the very least the market is expecting a dovish outcome which setups up for disappointment risk/hawkish surprise.
To put it another way, there is ~9bps of cuts priced into 2019. If Fed stays neutral and does not adjust rates at all this year, the market has to price out those 9bps of cuts. That would be the dovish disappointment trade which would flatten the curve.
2) Fed pulls back on the AIT rhetoric – that also seems unlikely in the near-term at least given the core of Powell/Clarida/Williams have all spoken about the potential to use average inflation targeting as a new tool very recently. Why stop now? The real AIT risk will take hold around June 4-5th time frame when the Fed is scheduled to discuss AIT and other new tools. Some former Fed officials seem to think AIT will not happen, but the narrative should remain for at least the next couple months.
3) There is no SOMA maturity shift to lower duration – this is a micro reason for curve steepening but since Quarles said on Feb. 23rd that “all things considered we should go back to a shorter duration,” the curve gained renewed strength. Thus any pullback from this view could cause a curve correction.
4) Pension demand resurfaces – as I showed last week, pensions “waved in” bonds last year ahead of the Sept. 15 tax deadline but has since slowed those purchases (as seen in the stripping data). Pensions will never leave the bond entirely since it lines up with their maturity profile, so there is always a risk pension demand reemerges.
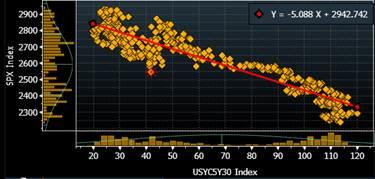
5) S&P rally or correction? – this one is interesting, tricky, and nuanced. 5s30s used to be a strong risk off hedge, but there has been a correlation flip ever since the Fed went neutral/dovish.
You can see over the period from Dec 2016 to Dec 2018, 5s30s had a NEGATIVE 93% correlation to S&P’s…
Now over the period of Dec 2018 to present, 5s30s has a POSITIVE 80% correlation to S&P’s…
There has been a regime change here and we can safely attribute it to the dovish pivoting Fed which drove risk assets higher and also signals the end of cycle which 5s30s steepeners also enjoy. But with 5s30s at this inflection point, the question becomes which regime will the equity/curve relationship be in going forward?
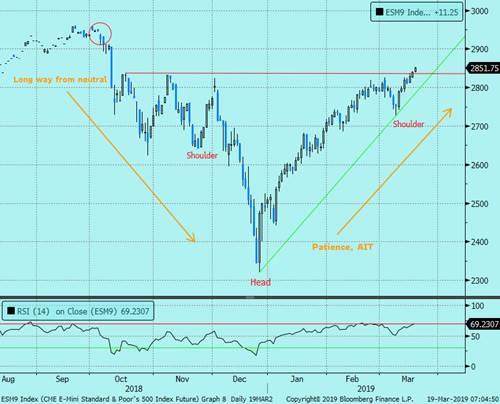
It is no wonder that at the same time 5s30s is at an inflection point, S&P’s are also hitting a similar resistance level. How far we have come from the Oct. 3rd “long way from neutral” disaster that sent risk assets into a tail spin. Now Fed policy is all about “patience” and “letting it run hot.” This pivot has put S&P’s almost right back to where it started in October. Poorly played and then nicely played JPo. Now what? So far this morning S&P’s are breaking out above the 2835 resistance level. This is important technically as it confirms the bullish inverse head and shoulder pattern. I hope you are sitting down as from a pure technical textbook stand point, this formation targets….wait for it….3,345 (~15% higher from here)…
If the technicals are right, that rally would likely only happen after the buyback blackout which is approaching.
Here is my point with regards to equities and curve: This leg up in equities and 5s30s has been led by a Fed that has become concerned about growth and ended its tightening cycle. Now that equities have basically retraced the entire Fed induced sell off; will further equity strength mean additional 5s30s gains? To take it a step further, at some point with equities back in the “safe zone,” will the Fed ease off the dovish rhetoric a bit which would deflate some of the “end of the cycle” narrative?
Those are the key questions and the answer will be centered on the incoming growth data. My guess is that now we have priced in the dovish pivot, the old regime will reemerge – meaning the curve will go back to a riskoff hedge. Thus, with some signs of a data bounce (which is not surprising given how much equity prices have rebounded and how levered the US economy is to the equity market); that could be the cause of a curve correction.

Those are all the reasons why the curve COULD correct at this inflection point. That correction should be bought once some of the “crowdedness” gets rinsed. The long term fundamental and technical bull case remains.
I am actually becoming more convicted the curve will steepen this year. A growth reacceleration is becoming less and less likely the longer trade wars drag on. As we have seen in the news over the weekend, it now looks probable there will be no Mar-a-Lago deal in March with a delay out to June now becoming the most probable path. That means three more months of muddling data that will only feed into the “end of cycle” narrative which will re-steepen the curve after this potential correction. Even if China/US trade wars do get settled, there is high risk the US attention will shift to the EU. That remains an underpriced risk.
via ZeroHedge News https://ift.tt/2HDTGeW Tyler Durden