Ten years after central banks launched the greatest monetary experiment in history, pushing rates to zero or lower in an attempt to reflate away an unsustainable debt load while purchasing $12 trillion in securities to prop up risk assets, we are back where we started with deflation once again emerging as the biggest threat to the world, over $10 trillion in sovereign bonds yielding below 0%, and after a disastrous attempt at renormalizing monetary policy, the market is convinced the Fed will cut rates in the next few months.
But besides the greatest roundtrip in monetary policy over the past decade, few things are as they were in 2009.
To demonstrate that, BofA’s Michael Hartnett has published its latest “Hitchhiker’s Guide to the Investment Universe”, which is a primer for investors on the size, composition, risks, returns, flows, valuations of bond & equity universe. The report also finds that, as expected, Wall Street is still “too big to fail”, “Japanification” of growth and rates is prevalent, tech is dominant, there is $175 trillion of assets, there are 536 zombie companies, tech represents 26% of market cap, analysts miss bond yield forecasts by 100bps annually, and much more.
Below we list 20 stunning facts from the report, highlighting Wall Street life, the investment universe and everything…
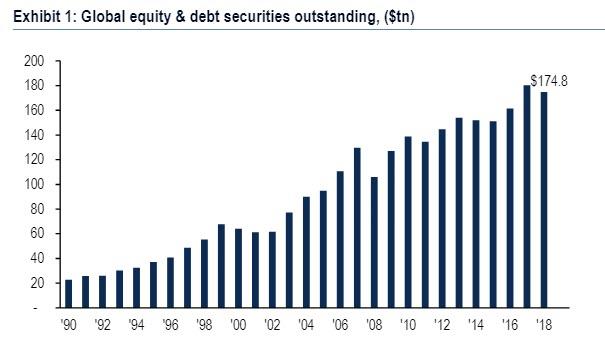
1. $175tn: current value of global financial assets, 2X the size of global GDP
Wall St. is still “too big to fail”: The total value of global stocks & bonds outstanding has jumped by 8x since 1990, from $23tn to $175tn today.
Global asset values are 2X the size of the global economy; Global asset values fell in 2018 from $180tn to $175tn. .
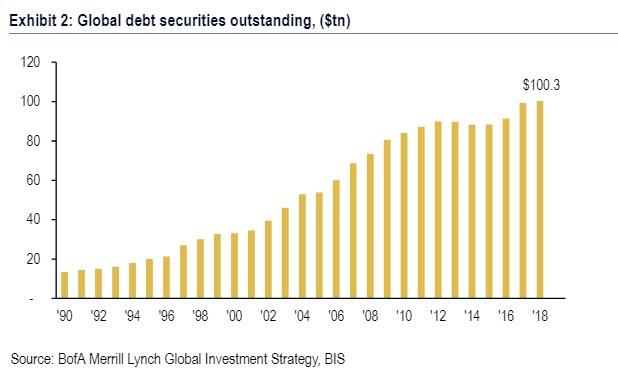
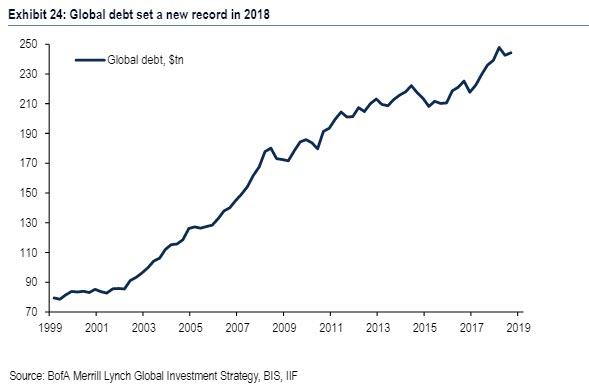
Global debt outstanding is now $100tn, up from just $13tn back in 1990; Debt represents 57% of global financial assets.
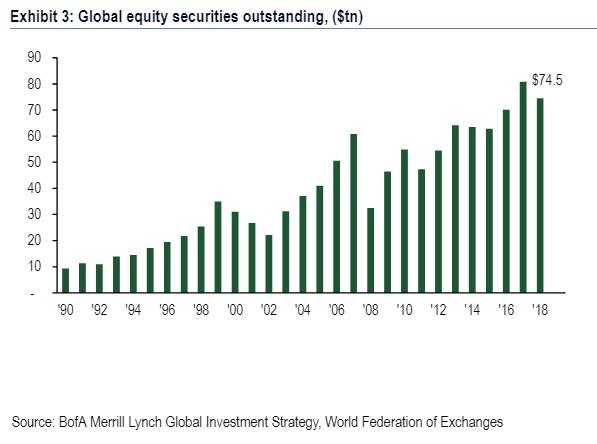
The value of global equities outstanding has similarly surged from $9tn in 1990 to $75tn today. World stocks equities tripled in value between the Global Financial Crisis (GFC) lows in Mar’09 to their most recent peak of $90tn in Jan’18.
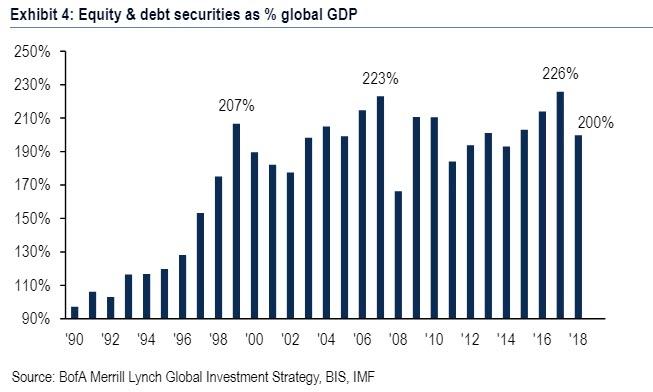
Financial assets are now 200% of global GDP; back in 1990 they were 97%. The most recent peak in financial assets as a % global GDP in 2017 was 226%, just above the 2007 highs.
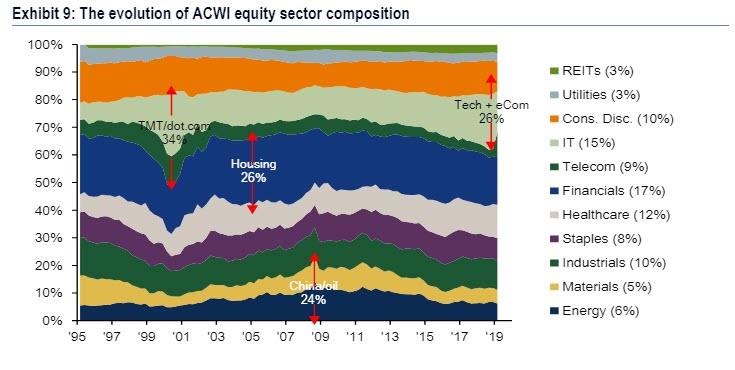
2. 26%: US tech & e-commerce as % of US equity market capitalization
The past 10 years have witnessed the 2nd great bull market in technology in the past 25 years. In 2018, tech & e-commerce sectors accounted for 26% of total market cap (21% today); rivaling prior sector extreme: in the 2000 dot.com bubble TMT was at 34%; in the 2006 housing bubble financials were 26%, and in 2008 during the China/oil bubble, energy & material sectors @ 24%.
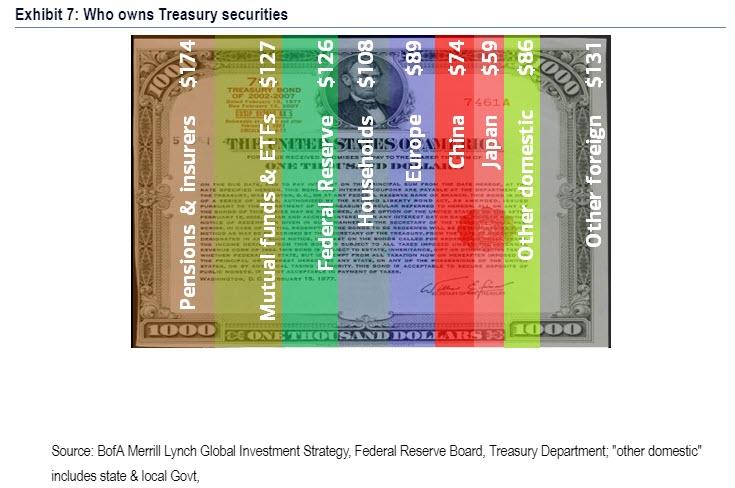
3. 7%: US Treasury market owned by China, largest of any country
China, the world’s second largest economy, is the world’s biggest single country foreign owner of US government debt. Pensions & Insurers (17.4%), mutual funds & ETFs (12.7%) and the Federal Reserve (12.6%) hold the most securities outright.
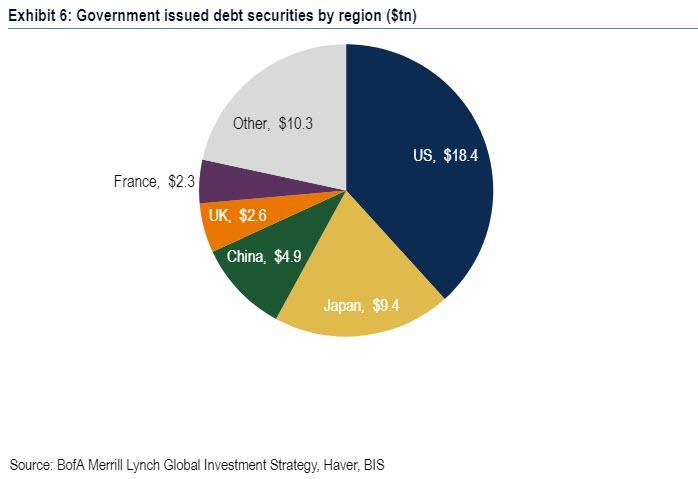
The US Treasury market is by far the largest government bond market in the world accounting for $18.4tn of debt securities: almost $4 of every $10 of government debt outstanding is a US Treasury. The next 4 largest government bond markets are Japan, China, UK & France.
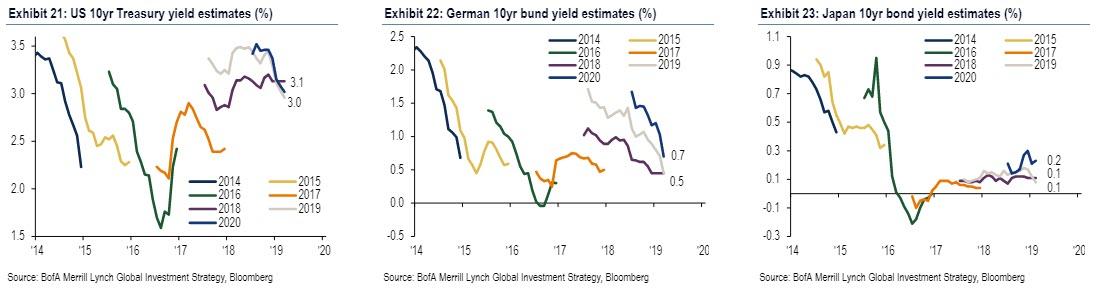
4. 0.2%: the end-2020 consensus forecast for Japan’s 10-year JGB yield
Additionally, every year since 2014 Treasury yields have been forecasted to end each year above 3%; every year they have failed to do so. Across the Atlantic, in the past 6 years the consensus has over-predicted German bond yields by on average 100 basis points. And the forecast for the 10-year JGB yield at the end of 2020 is a pitiful 0.2%. The “Japanification” of global interest rates of the past 10-years thus continues apace.
5. Four deflationary Ds of excess Debt, bank Deleveraging, tech Disruption, and aging Demographics explain the consistent undershoot of inflation expectations.
The inability of monetarism to boost wages and income in the world’s largest economic regions is sparking a populist backlash amongst electorates.

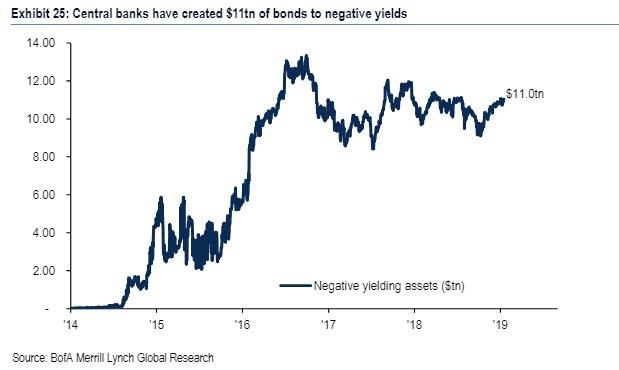
6. There is $11 trillion in global negatively yielding bonds
One reason growth & inflation has disappointed in the past 10 years is the ever-growing level of debt, which is not “multiplying” into economic activity, but is rather leading consumers & companies to increase savings and suppress “animal spirits”. As of Q3 2018 global debt equaled $244.2tn, equivalent to 318% of world GDP.
While debt is at a record high, interest rates are close to record lows. The reason is the unprecedented intervention in debt markets by central banks. “Financial suppression” means there are $11.0tn of bonds trading with negative yields today.
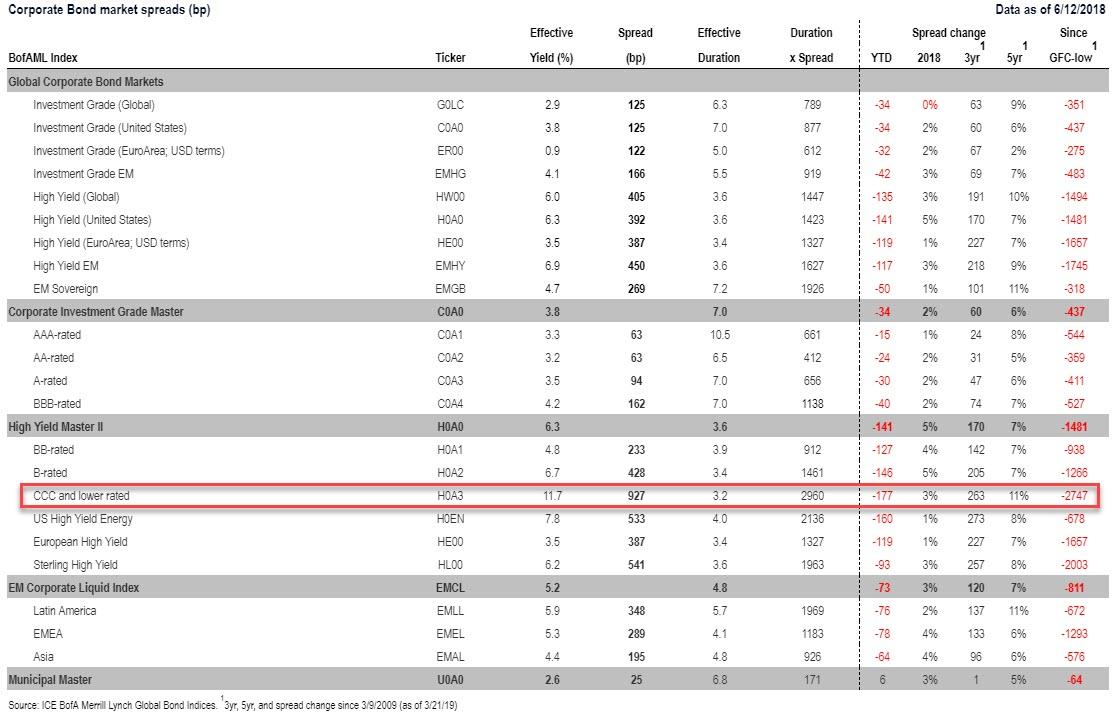
7. 2747bps: the staggering drop in US CCC High Yield bond spreads since 2009
8. 2018: 1st year since 2000 that cash outperformed bonds and stocks
This table shows global cross-asset total returns since 2000, in USD terms. Annualized asset returns since QE began in 2009: US stocks 15%, global HY bonds 12%, Treasuries 2%, cash 0%, commodities -1%. In 2018, cash outperformed bonds and stocks for the first time since 2000.

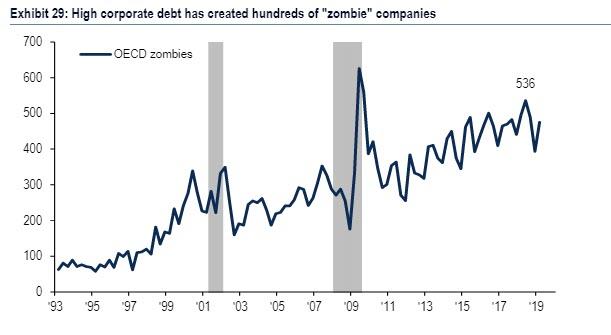
9. 536: the number of zombie companies in the world, 13% of total
Ominously, low interest rates and the ability of lower-rated companies to issue debt has led to a rise in the number of “zombie” companies, i.e. companies that are extremely indebted and are unable to stay on their feet without the current backdrop of historically low interest rates. In 2018, the number of “zombie” companies, defined as companies with profits (EBIT) less than interest payments totaled 536, not far off the highs seen during the Global Financial Crisis (626).
10. $5.5tn: market cap of US tech sector, >entire market cap of Emerging Markets
he second tech bubble: US tech is now by far the biggest individual sector in the global stock market at $5.5tn market cap, larger than all EM stocks ($5.4tn) and Eurozone stocks ($4.4tn); and 3x the size of all other tech sectors combined.
The second largest equity market, Japan, is almost 8x smaller ($3.3tn) than the US ($25.0tn). Financials ($7.6tn) remain the largest outright global sector but now only account for 16.7% of global stocks, well below their prior peak of 26.1% in Jan’07.
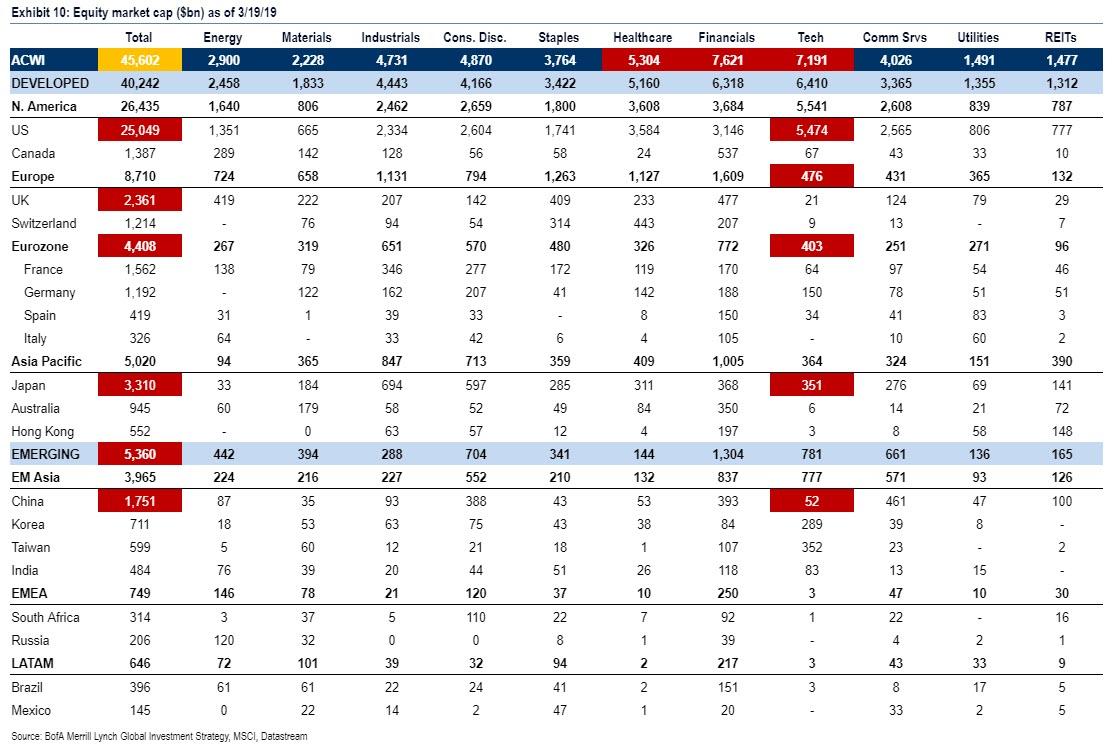
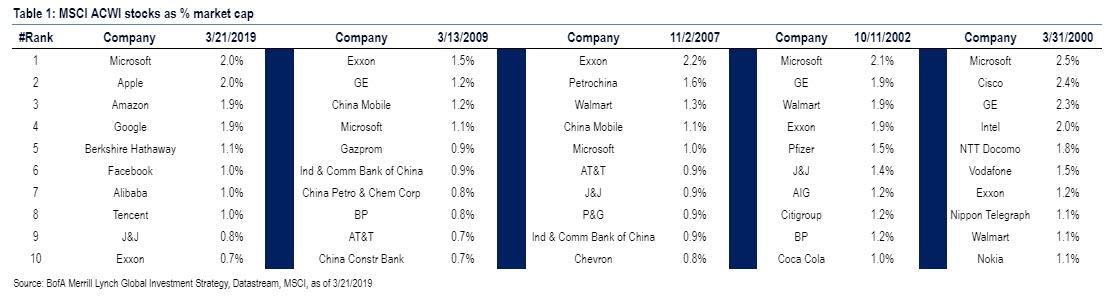
US tech companies account for 5 of the 7 largest companies in the world by market capitalization, and 7 of the top 10 companies in the world are tech companies. Microsoft is the only company to feature in the top 10 stocks throughout the 21st century.
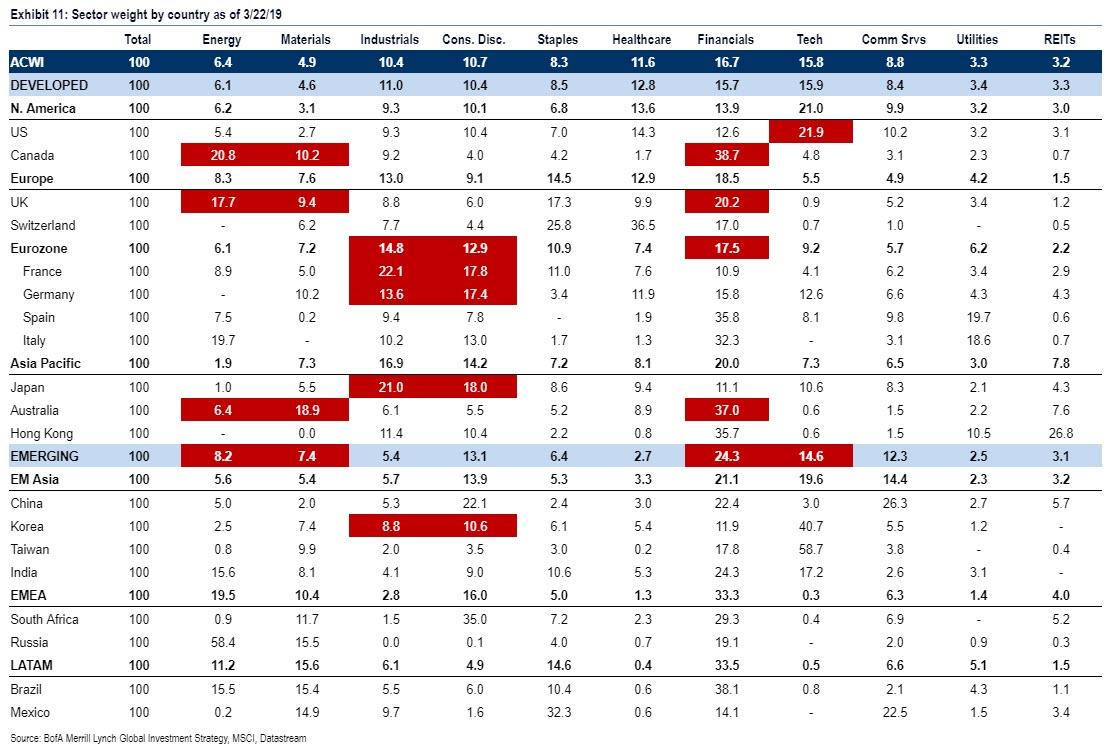
11. 1/3: financials as % market cap >1/3 in Canada, Spain, Italy, Australia, Brazil
Tech (14%) now plays a substantial role in Emerging Markets, but the financial sector (24%) is the main driver of EM; this is a major change from 2008 when energy & resources represented 36% of the EM index. As a result, the catalyst for EM to outperform has shifted from commodity prices to global rates. Eurozone equities are highly cyclical and disproportionately reliant on financials, notably Italy (32%) and Spain (36%). The Eurozone’s next structural bull market awaits the end of the current era of negative interest rates.
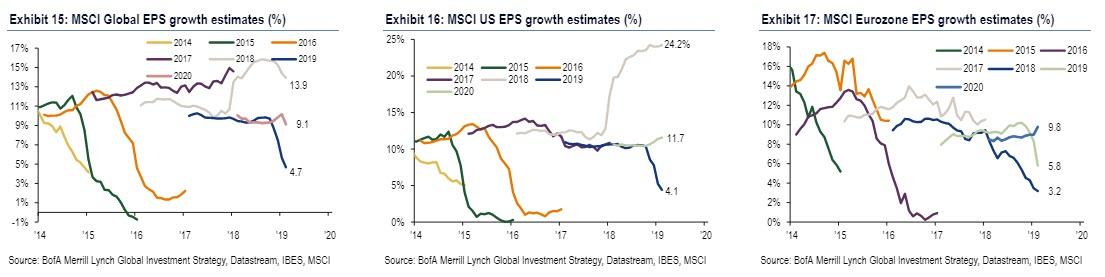
12. 4%: Global EPS growth forecast in 2019, down from 24% in 2018
The US economic cycle is set to become the longest in history in July 2019; but US, Eurozone & Chinese growth has repeatedly struggled to exceed expectations. The inability of economic growth to hit “escape velocity” helps explains why global profits have consistently missed expectations, most notably in Europe. Years of big upside surprises to EPS have typically been the results of one-off policy interventions, for example the 2018 US tax cuts.
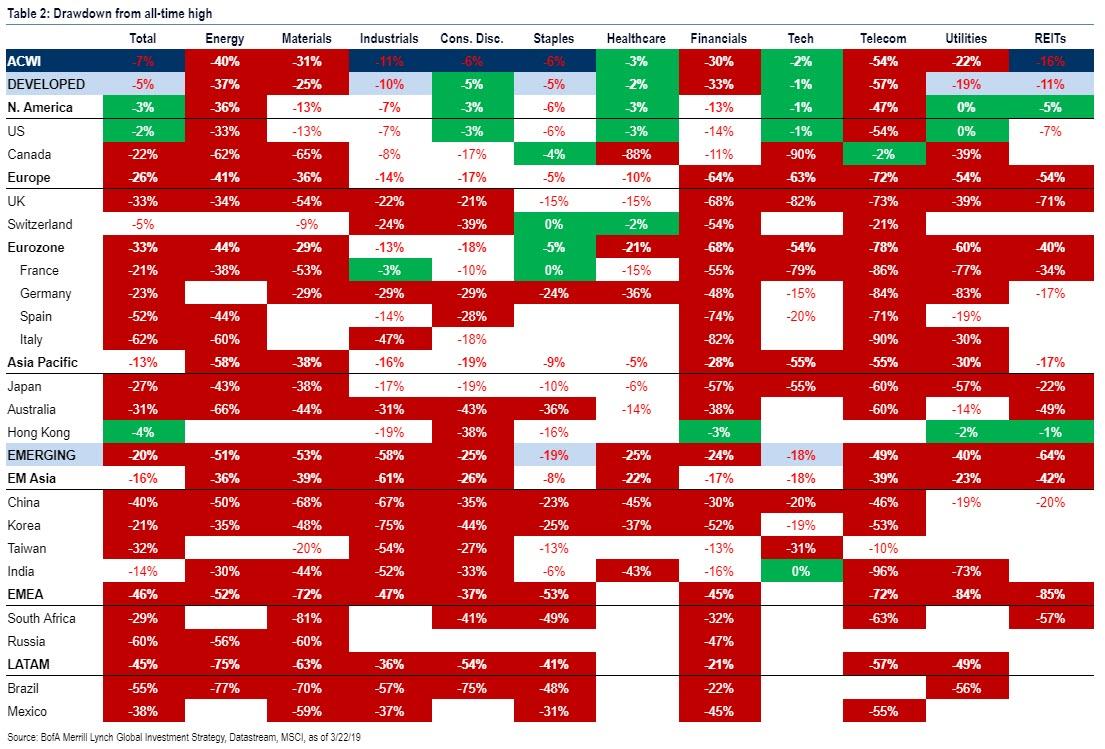
13. 3498: the level at which the S&P 500 bull market becomes the biggest ever
This chart shows how far equities are from their all-time highs, in US dollar (green = <5% from high, white = 5-20% from high, red = >20% from high). US equity market -3% from all-time high; stark contrast to Japan (27% from high), Eurozone (33%), China (40%), Spain (52%), Italy (62%).
14. 68%: the rise in stock price needed for Eurozone banks to reach old highs
Of particular note, Eurozone banks are still 67% off their all-time highs, Korean industrials 75%, Italian financials 82%, South African materials 81%.
15. 67%: the % of the global equity market >20% away from its all-time high
10 years into the bull market, only 9% indices within 5% of all-time highs, 24% are within 20% and a 67% in “bear markets”, i.e. >20% away from highs.
16. 17bps: the CDS of the “safest” company in the world, Nestle
These tables show the largest 25 companies, ranked by market cap & credit default swap spreads, as well as the most creditworthy countries. Nestle is the creditworthy mega cap in financial markets (CDS = 17bp), Alibaba the least (CDS = 84bp). Switzerland (12bp) overtook Germany (13bp) as the most creditworthy country in May 2018; the least is Venezuela (7760bp, peak was 15559bp in Nov’17). US & European most creditworthy sectors = European & US IG healthcare; least = European discretionary HY, US staples HY (Bloomberg).

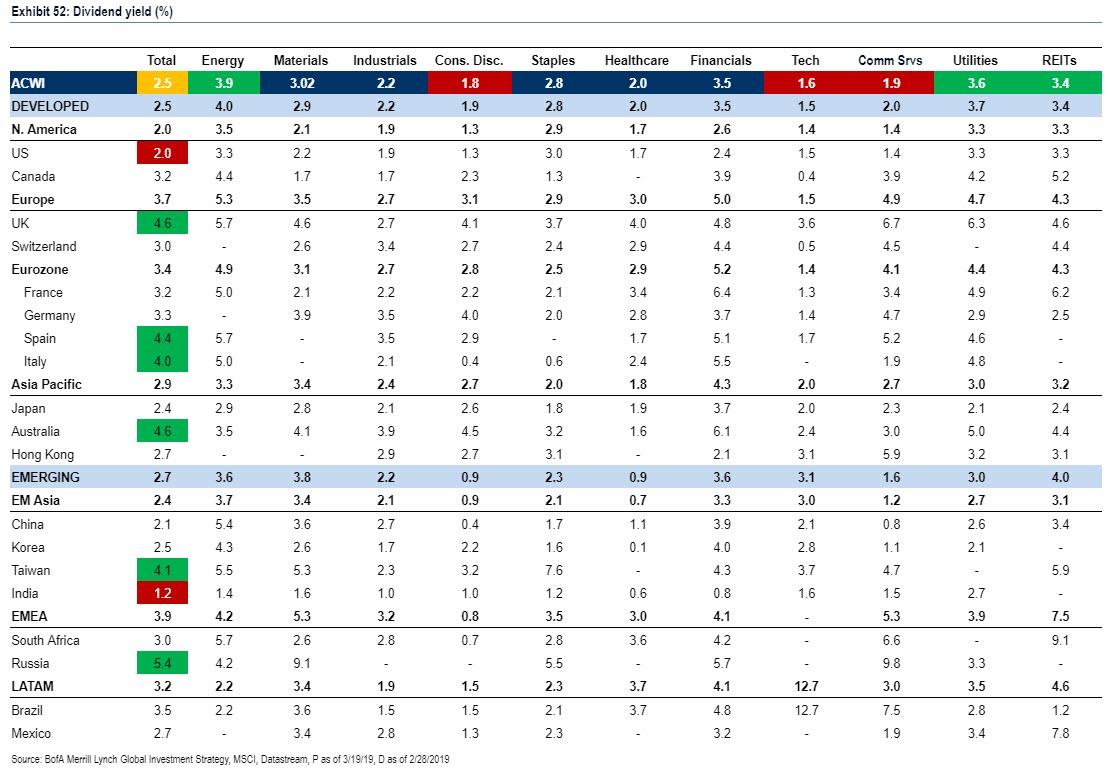
17. 2.5%: dividend yield of global equity index, below its historic average of 2.9%
This table shows dividend yields around the world: it shows that global equities currently yield 2.5%. Dividend yields in excess of 3.5% (cheap) can be found in Russia, Australia, UK, Spain, Italy, Taiwan, energy, utilities, REITs. Dividend yields below 2% (expensive): India, US, tech, discretionary, communications.
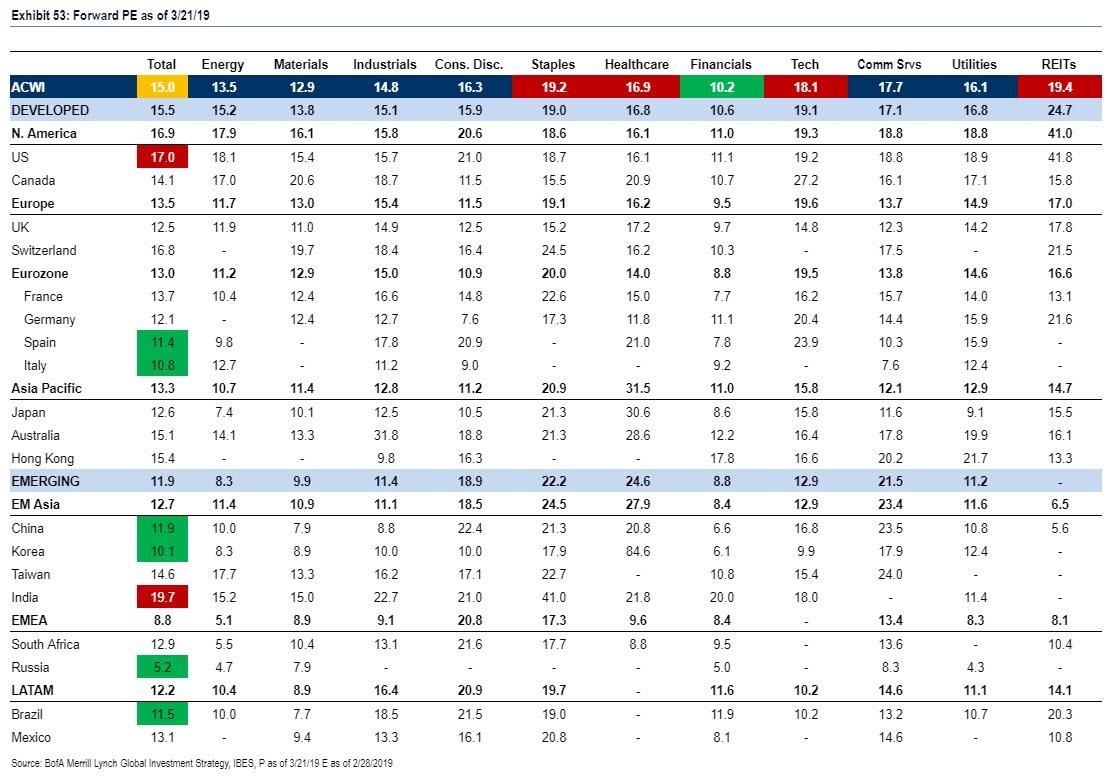
18. 15X: price-earnings ratio of the global equity index, below its 15.7X average
This table shows price/earnings ratios based on 12-month forward earnings. Global equities are currently trading on a forward P/E multiple of 15.0x. P/E multiples above 17x (expensive): India, US, REITs, staples, tech, healthcare. P/E multiples below 12x (cheap): Russia, Korea, Italy, Brazil, Spain, China, financials.
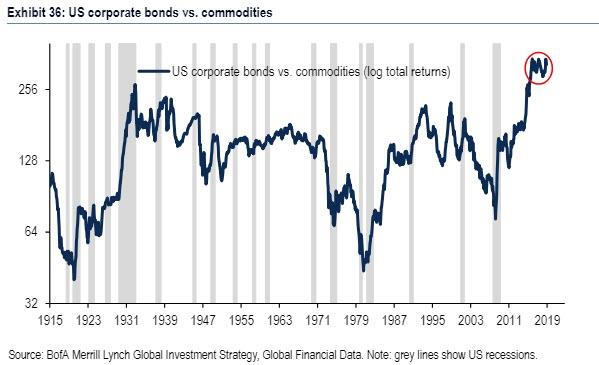
19. 100: corporate bond prices relative to commodity prices close to 100-year high
This chart shows the performance of US corporate bonds vs. commodities in the past 100 years. US corporate bonds hit an all-time high versus commodities in June 2017, exceeding the prior high set during the Great Depression in 1933; they remain close to that high today.
20. 2002: last time commodities best performing asset class (as they are in 2019)
via ZeroHedge News https://ift.tt/2COxYBI Tyler Durden