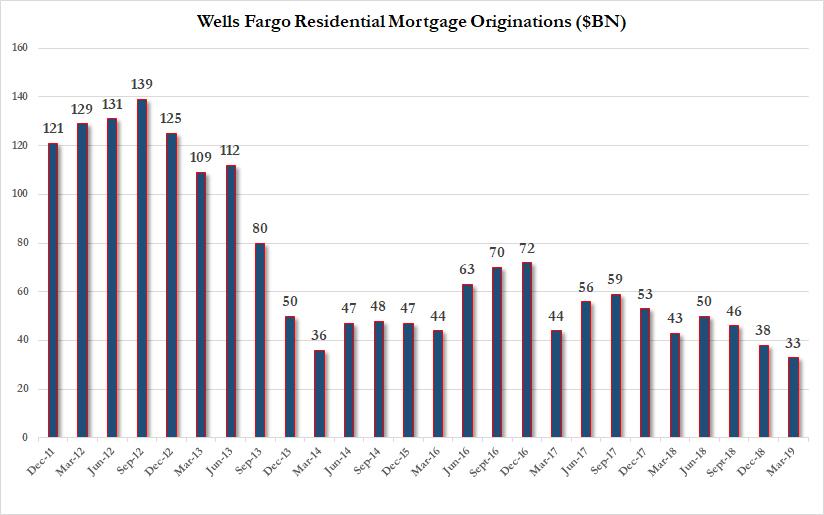
When we reported Wells Fargo’s Q1 earnings back in January, we drew readers’ attention to one specific line of business, the one we have repeatedly dubbed the bank’s “bread and butter“, namely mortgage lending, and which as we then reported was “the biggest alarm” because “as a result of rising rates, Wells’ residential mortgage applications and pipelines both tumbled, sliding just shy of the post-crisis lows recorded in late 2013.”
Well, unfortunately for Wells – which until recently was the largest US mortgage lender – despite the sharp drop in yields in Q1 which many had expected would boost mortgage lending or at least refi activity for the bank that was until recently America’s largest mortgage lender, the decline in mortgage activity has continued, because buried deep in its presentation accompanying otherwise unremarkable Q1 results (modest revenue and EPS best), Wells just reported that its ‘bread and butter’ is once again missing, and in Q1 2019 the amount of all-important Wells Fargo Mortgage originations shrank again, dropping to just $33 billion, down $5 billion sequentially, and the lowest level since the financial crisis. Putting this number in context, just six years ago, when the US housing market was actually solid, Wells was originating 4 times as many mortgages, or about $120 billion.
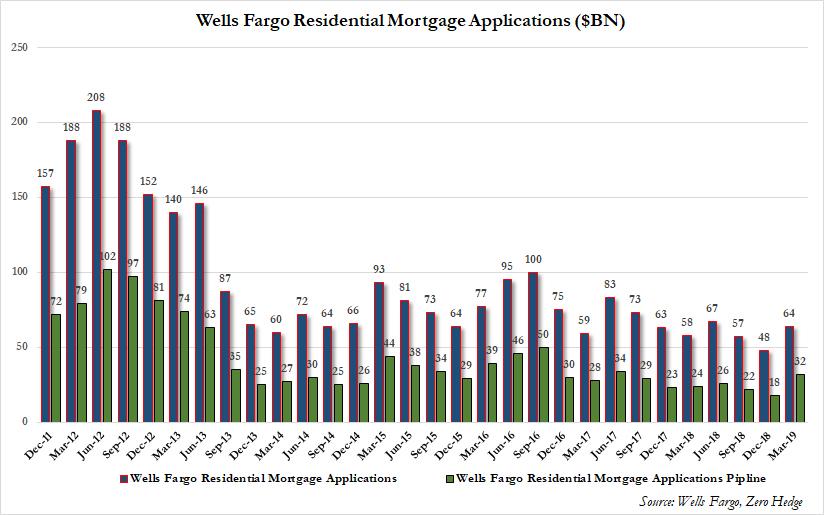
That said, there was finally some good news regarding the bank’s mortgage platform, where mortgage applications and the applications pipeline both jumped notably, with the former rising to $64 billion from $48 billion, and the latter printing at $32 billion, the highest since Q2 2017, arguably driven by the recent drop in interest rates.
And since this number lags the mortgage applications, we expect it to continue posting fresh post-crisis lows in the coming quarter especially if rates resume their rise.
Going back to the headline numbers, here is a recap of the key metrics:
- 1Q adj. EPS $1.20, est. $1.08
- 1Q revenue $21.61 billion, Exp. $20.87N
- 1Q net interest income $12.3 trillion
- 1Q loans $953.11 billion vs. $942.3 billion q/q
- 1Q mortgage non-interest income $708 million, up from $467 million in Q4
- 1Q margin on residential held-for-sale mortgage originations 1.05%, up from 0.89%
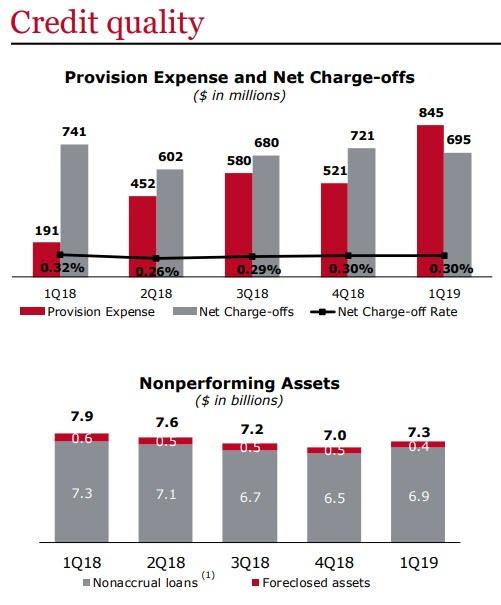
- 1Q non-performing assets $7.34 billion, up from $6.95 billion
- 1Q net charge-offs $695 million, down from $721 million, estimate $821.3 million (BD)
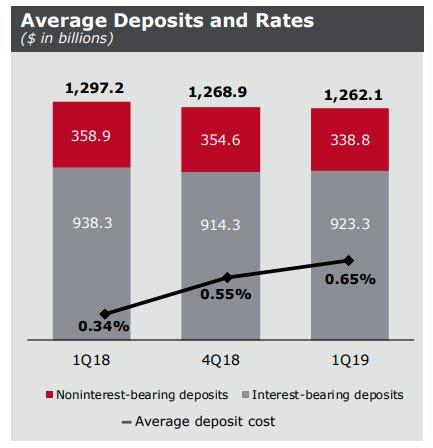
- 1Q total avg. deposits $1.3 trillion, up from $1.27 trillion
There was more bad news for Wells. First, as the chart below shows, Noninterest Income has been a disaster and is only getting worse, with the Q1 number down another 4% YoY to $9.3 trillion.
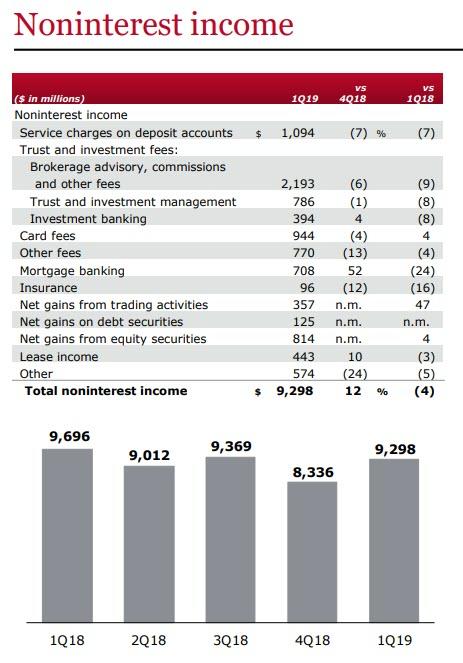
Things were not better on the interest income side where the bank’s Net Interest Margin suffered a sharp drop, sliding to 2.91%, the lowest in one year and below the 2.93% expected (a far cry from JPM’s NIM increase), and resulting in $12.311 billion in Net Interest Income, the lowest since Q1 2018. This is what Wells said: ” NIM of 2.91% down 3 bps LQ on the impacts of balance sheet mix and repricing, including higher deposit costs.”

While Wells loss net charge-offs declined modestly in Q1, its actual provisions soared from $521MM to $845MM, the highest in years, and prompting questions just what Wells may be seeing. Also of note: non-performing assets soared by $0.3 billion to $7.3 billion, a sharp reversal in recent improving trends.
There was another problem facing Buffett’s favorite bank: while NIM failed to increase, deposits costs are rising fast, and in Q1, the bank was charged an average deposit cost of 0.65% on $923.3MM in interest-bearing deposits, double what its deposit costs were a year ago. Meanwhile, total deposits continued to shirnk, dropping to $1.262 trillion from $1.297 trillion a year ago.
And some more bad news: the recent rebound in the bank’s balance sheets appears to have again reversed, because one quarter after period-end loans rose from $942.3BN to $953.15BN, average loans outstanding once again resumed their drop, sliding to $948.2BN, down $4.9 billion “on lower consumer and commercial loans.”
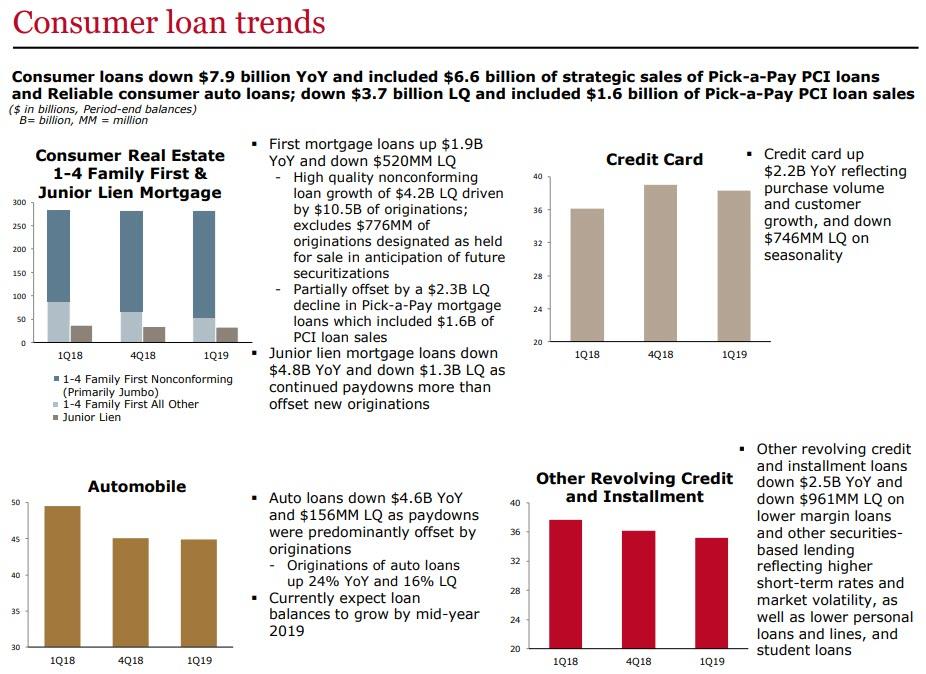
Meanwhile, consumer loans continued to decline, and were down $835 million LQ as growth in nonconforming first mortgage loans and credit card loans was more than offset by declines in legacy consumer real estate portfolios including Pick-a-Pay and junior lien mortgage loans due to run-off and sales, as well as lower auto loans.

And finally, there was the chart showing the bank’s overall consumer loan trends: these reveal that the troubling broad decline in credit demand continues, as consumer loans were down a total of $7.9BN Y/Y across most product groups, including $6.6 billion of strategic sales of Pick-a-Pay PCI loans and consumer auto loans; loans were also down $3.7 billion from last quarter as the balance sheet shrinkage continues.
What these numbers reveal, is that the average US consumer can barely afford to take out a new mortgage even at a time when rates are once again sliding. It also means that if the Fed is truly intent in engineering a parallel shift in the curve of 2-3%, the US can kiss its domestic housing market goodbye.
Source: Wells Fargo Earnings Supplement
via ZeroHedge News http://bit.ly/2P8KSzx Tyler Durden