Authored by Mark Orsley, Head of Macro Strategy at PrismFP
Friday turned out to be an interesting day in yield space as US 10yr yields, for example, broke down sharply (hey 1/2 point is a lot in this low vol regime). This may be somewhat confusing as the data in the US has really been lackluster with US economic surprise indices remaining at local lows.
However, the story is the cyclical upturn in China something commodities, as shown a couple weeks back, were foreshadowing. The slew of better data out of China is turning yields back higher along with it.
China CPI, M2, Exports, and Aggregate Financing all turning higher off the lows
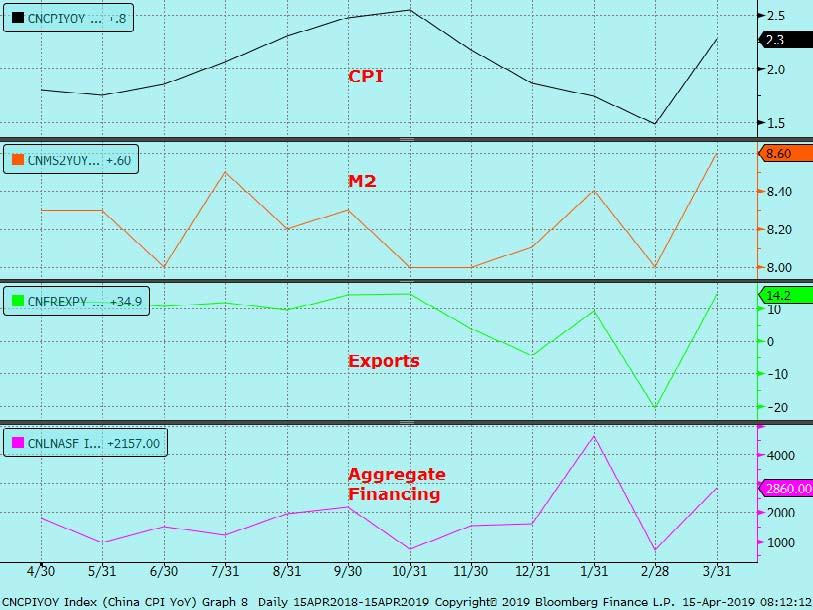
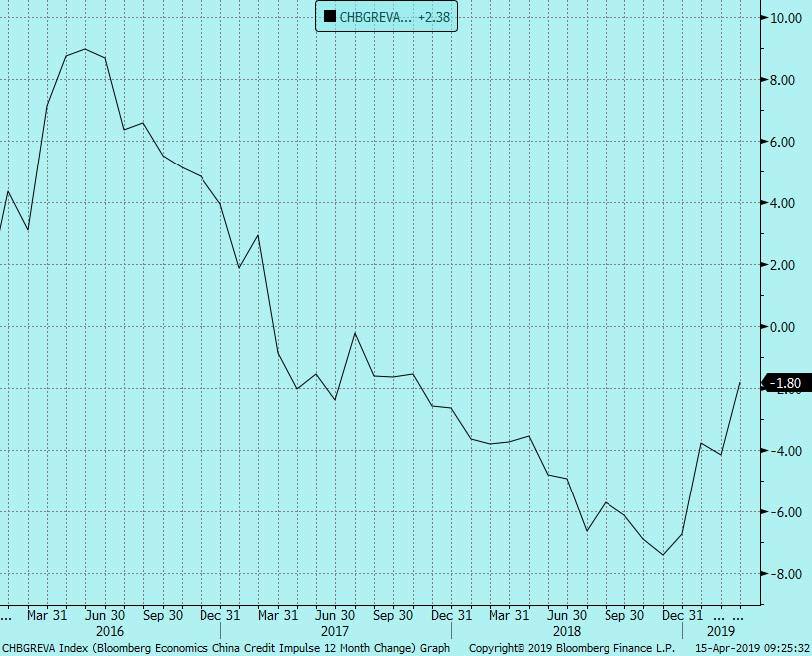
The bounce in the data has been led by the myriad of stimulus measures (I have lost count) and the credit impulse.
China Credit Impulse 12 Month Change
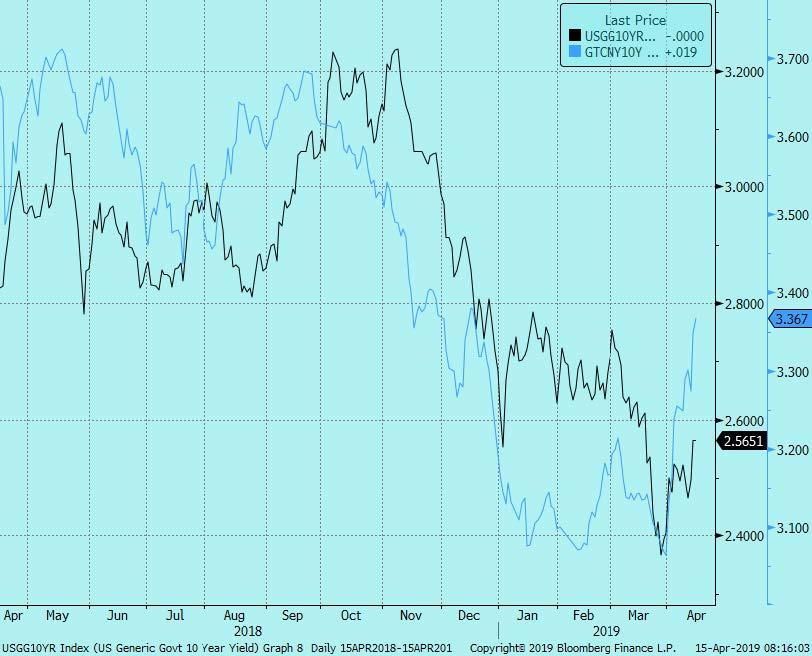
Thus, Chinese yields, which led US yields on the way down, is now leading US yields higher…
Chinese 10yr yields (blue) vs. US 10yr yields (black)…
That’s what got us here today, where now…
It still seems that US yields are too low for a number of reasons that would mean a tactical sell off can continue. I have been advocating Blue Eurodollar downside which have now started to turn profitable.
First, the fixed income market, which had been positioned short for quite some time, has now gotten flat. Using Eurodollars as the proxy, you can see specs have short covered all year and are now close to flat for the first time since 2016. Therefore, all of the excessive bearishness from 2018 has been vaporized and positioning is clean.

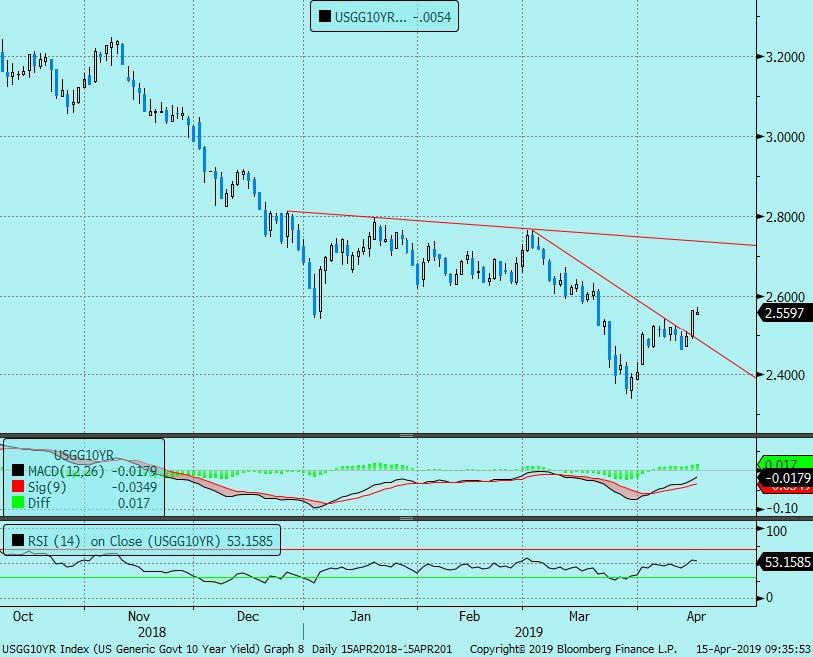
As I showed a couple weeks back, the 2.50%/2.60% is the sweet spot for put gamma to kick. Thus once 2.50% was broke on Friday, you got an acceleration to the downside in 10yr note futures…

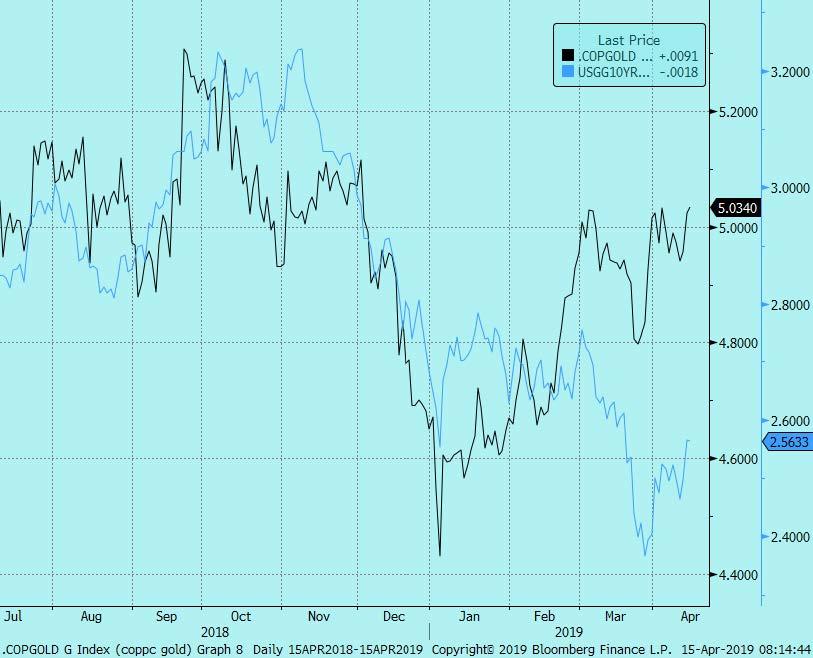
As a reflation type signal, the old Copper/Gold ratio continues to signal that rates should continue to rebound.
Copper/Gold ratio (black) vs. US 10yr yields (blue)….
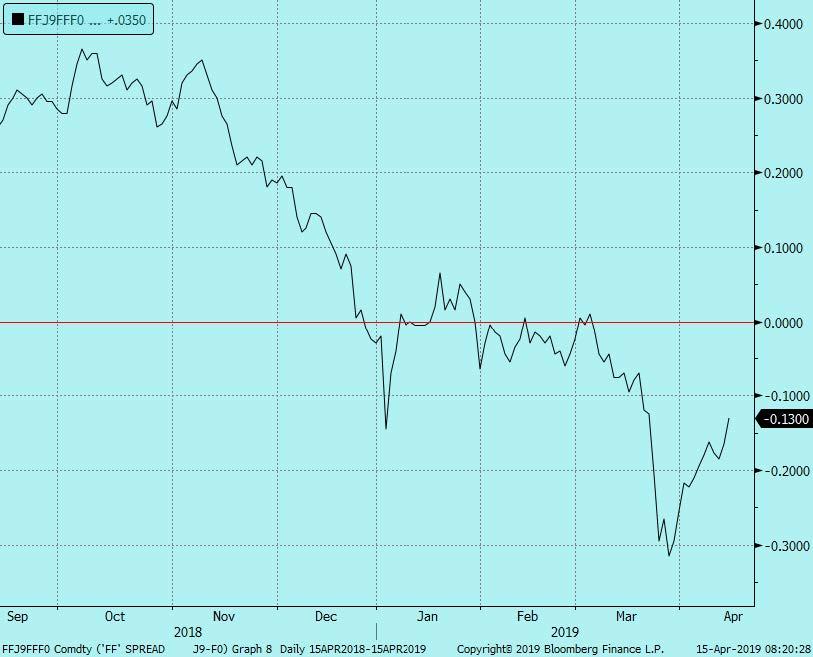
Despite the Chinese data turning higher, the US fixed income market still believes there will be cuts in the US in 2019.
April 2019/January 2020 Fed Fund spread implies 13bps of cuts in 2019…
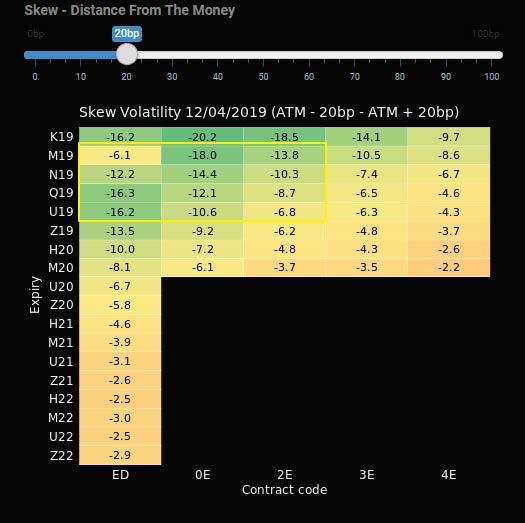
Similarly, in front end option space, put skew in Eurodollars are well offered vs. call skew signaling players are positioning for rate cuts.
It seems to me that the tactical sell off can continue until those Fed cuts get priced out especially in the face of better Chinese growth that will feed into the rest of the world, at the same time short positioning is nil, and the Fed is neutral. 2019 rate cut/rate hike odds should be roughly equal and that means further tactical US fixed income weakness.
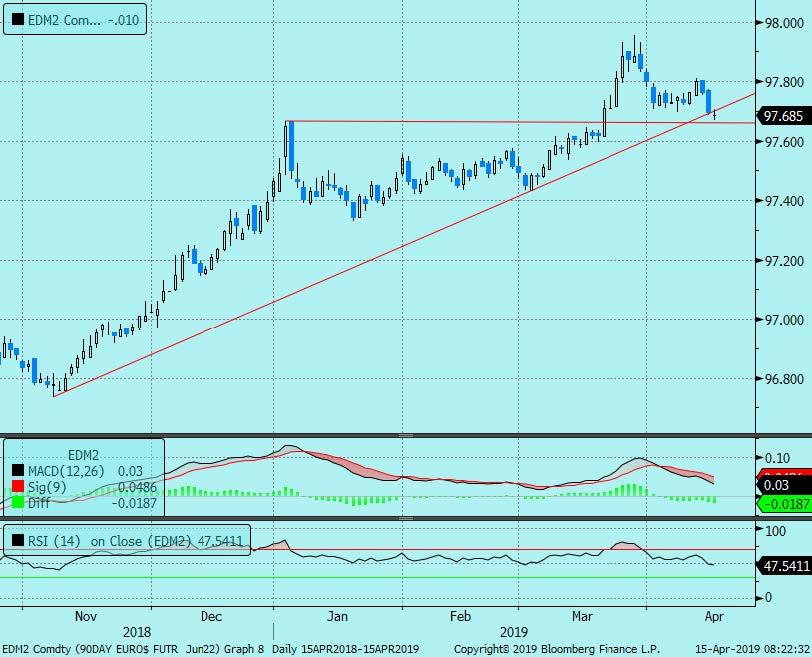
The next level to watch in Eurodollars (going back to the “blues” I have been focusing on) is 97.66 in EDM2 which is the top of the breakout in January. If that level gets taken out, you will see a sharp long liquidation.
EDM2 has broken its uptrend from the November lows. It re-tested that trend line this morning and is so far failing. A break of 97.66 would see an acceleration to the downside…
Now notice above that I underlined the word “tactical.” There are reasons why this sell off can only go so far. Obviously the dovish Fed and the “end of cycle” are the two big structural ones, but here are a couple more…
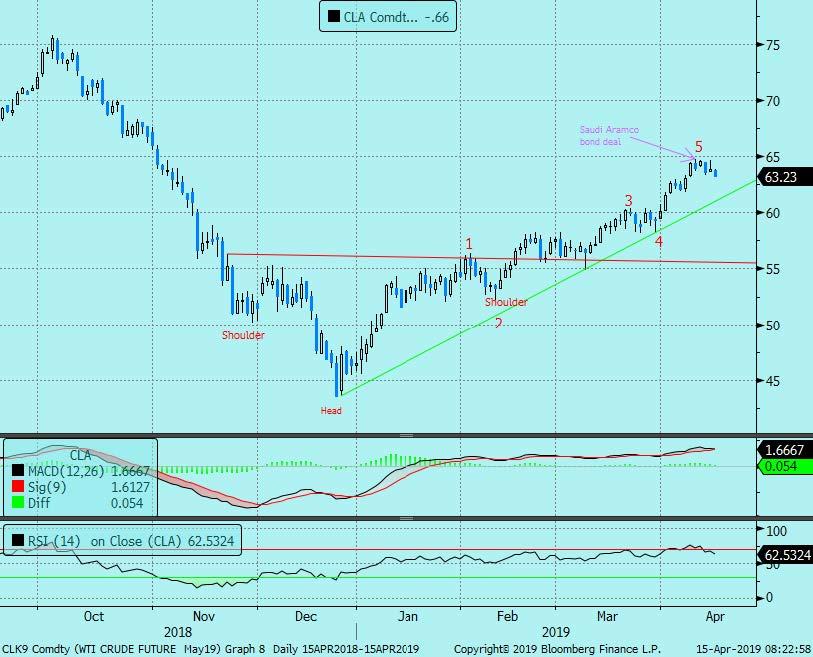
We have discussed WTI a fair bit this year with the narrative being a bullish technical formation that played into surprising Saudi production cuts (among many other reasons but to keep it succinct). The target was $65 and I would call it “close enough.” As I suggested last week, the Saudi production cuts seem to trough (conveniently) right around the time of the massive Saudi Aramco bond deal. It is therefore no coincidence that the highs in WTI so far was the day the Aramco deal priced. Therefore, the risk/reward to be long WTI at this point is not great and I believe most of the bullish technicals are now played out.
WTI’s bullish inverse head and shoulder formation has now fully played out as have the 5th Elliott Wave. Time to book profits on this one….
Peaking oil is obviously important with regards to yields as it feeds through to inflation expectations and thus nominal yields. Therefore, if the upside in oil is now limited, so is the upside in yields.
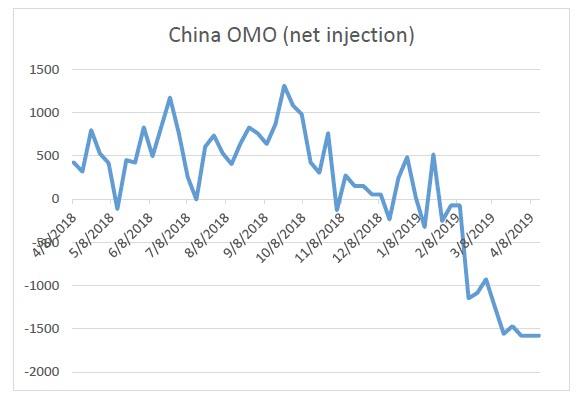
The second reason why yields are ultimately capped is although China has stimulated and there has been a credit impulse, it was noted in Bloomberg Monday that the PBOC will not “flood the economy with excessive liquidity.” That can be most clearly seen in the PBOC’s Open Market Operations (OMO’s) where they have skipped OMO’s for 18 consecutive sessions (until a modest injection on Tuesday). Thus from a net injection point of view, the PBOC has withdrawn liquidity – meaning letting things like reverse repo’s, MLF’s, etc. just expire.
So why not a 2.73% 10yr which happens concurrently with rate cuts being priced out that will keep yields in the new range? There are certainly a confluence of reasons why yields can get up to that region in the near term until the larger structural forces ultimately cap them.
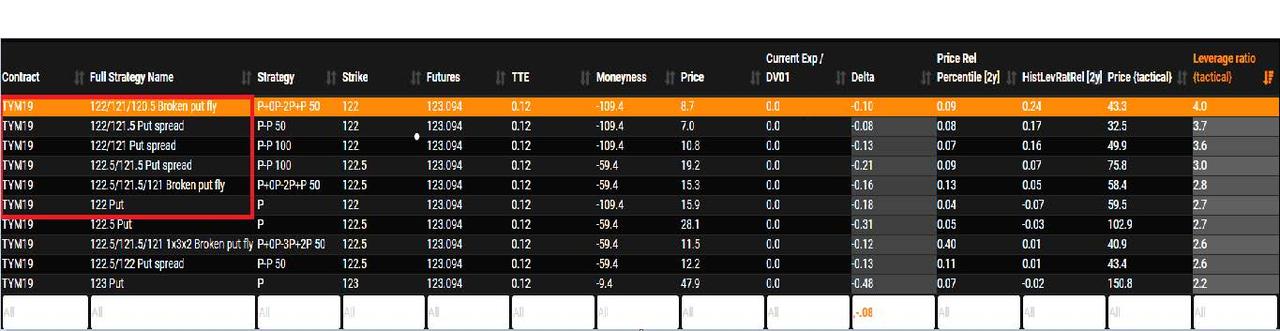
What are the trades to do in TY then? I ran the scenario in our PAM model for a selloff to the 2.70% region in the next 30 days, and scanned for structures with at least a -8 delta (nothing too “wingy”). PAM said to focus on the 122-00 strike. For me, the TYM9 122/121 put spread for ‘6/’7 is my preferred structure to capture this theme and that screens as the 3rd highest recommendation in our model…
As you can see here (and this may not come as a shock given vol levels); there has almost never been a better entry point to initiate the TYM 122-00 put….
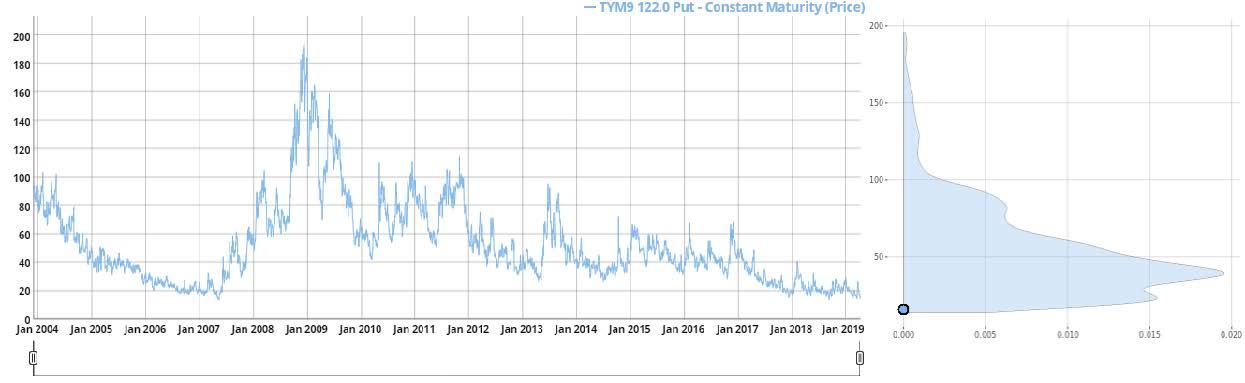
We are starting to see a bit of risk off here so the entry point is improving.
via ZeroHedge News http://bit.ly/2KJ2DHe Tyler Durden