Two weeks ago, Blackrock’s Larry Fink reincarnated the ghost of January 2018 past, when the CEO of the world’s largest manager told CNBC that “we have risk of a melt up.” While it wasn’t quite clear why to Fink a melt up is risky, the last time the US stock market experienced the sheer, unbridled euphoria of price indiscriminate buying was January 2018 when just days later the S&P tumbled by 10% in the aftermath of the infamous Volmageddon blow up of levered inverse VIX ETNs.
So what is Fink is right and a melt up, similar to the one observed for much of 2016 in the aftermath of the first Shanghai Accord, is on deck? The problem, at least optically, is that active asset managers, virtually all of whom have boycotted the rally ever since last December, will almost certainly not jump into stocks at all time highs, with most of them expecting at least a modest pullback as JPM’s Marko Kolanovic believes. And yet, by definition a melt-up does not end until there is bear capitulation and everyone jumps into the pool.
So there is a bit of a paradox as on one hand buybacks, gamma-imbalanced dealer desks and shorts keep pushing stocks higher even as active investors keep pulling money out of stocks.
This also brings up the question of what is the best way to trade a meltup if one can’t fully allocate capital at all time highs?
One answer to this question comes from Bank of America’s derivatives strategist, Benjamin Bowler, who recommends a trade that generated a 10x return during the last market meltup, back in 10x.
As Bowler writes in a note published overnight, as the S&P 500 enjoys its best start of the year since 1975, investors (many of whom have missed most of the gains) are wondering whether to hop on for the ride or avoid adding risk in case the end of the rally is near. Indeed, the recent “green shoots” in the global economy (not to be confused with the latest batch of distinctly adverse data, including China’s latest PMIs and today’s Chicago PMI in the US) and a benign positioning picture “suggest there may be room for US equities to run further”, according to the BofA strategist.
For instance, Bowler notes that the latest update of BofAML’s Library of Proprietary Indicators shows a bullish shift, led by the recovery/stabilization of global growth indicators. Meanwhile, as BofA’s CIO Michael Hartnett noted last Friday, equity positioning has not kept up with the rally; he argues that “greedy” flows could propel the S&P much beyond 3000, echoing the thesis that Marko Kolanovic has held ever since last October. Furthermore, adding to the “meltup risk”, “Fed tightening seems a thing of the past ‘even against soaring asset prices”, and Brexit and US-China tariffs have loosened their grip on markets for now, essentially minimizing three of last year’s main sources of risk.
The question therefore is simple: can positioning and “less bad” global economic conditions alone continue to push the S&P well past all-time highs? The answer, according to Bowler is that “today’s low volatility backdrop makes hedging upside risk easier, as options are inexpensive and can help avoid having to time the top of the market.”
How? By using short-dated S&P calls to “capture a melt-up without having to time a melt-down.“
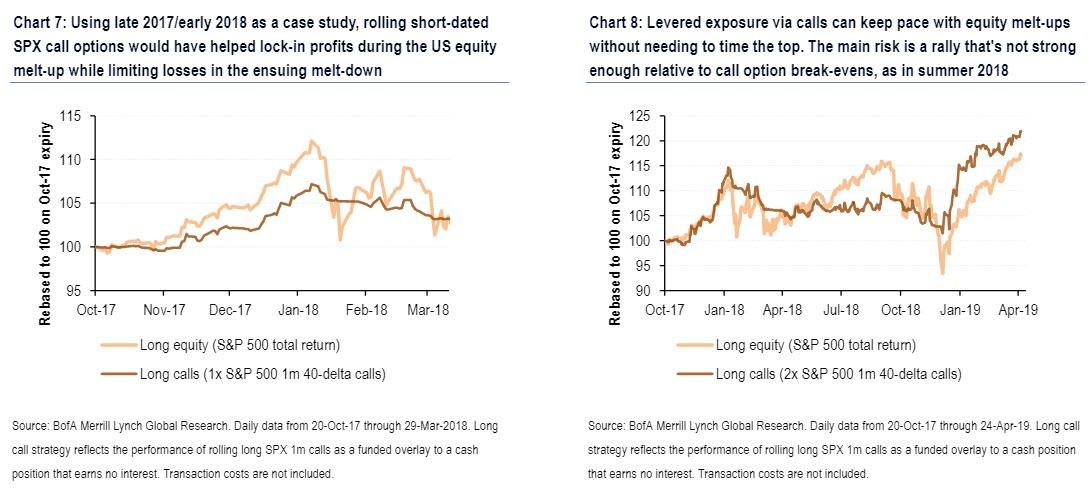
Referring to the behavior of the S&P 500 in late 2017/early 2018 as a case study, Bowler illustrates how “rolling short-dated SPX call options would have helped lock-in profits during the US equity melt-up while limiting losses in the ensuing melt-down.“
Indeed, in what may be the perfect high upside beta, low downside beta hedge, BofA notes that acquiring US equity exposure synthetically via long SPX 1m 40-delta calls would have gained ~7% from Oct-17 through the Jan-18 peak in equities (vs. ~12% for an S&P 500 total return investment) while losing less than 2% during the Feb-18 VIXplosion (as the S&P fell 10% – see Chart 7).
As another example discussed by Bowler and his team, twice the equity exposure via calls (as in Chart 8) would have enabled investors to more than keep pace with the equity melt-up while outperforming delta-one exposure in the Feb-18 and Mar-18 sell-offs. Such a strategy would have again outperformed in the Dec-18 correction and in the ensuing V-shaped recovery in markets in 2019. The main risk as seen from Chart 8 is a period like summer 2018 in which the S&P doesn’t rally strongly enough relative to call option break-evens.
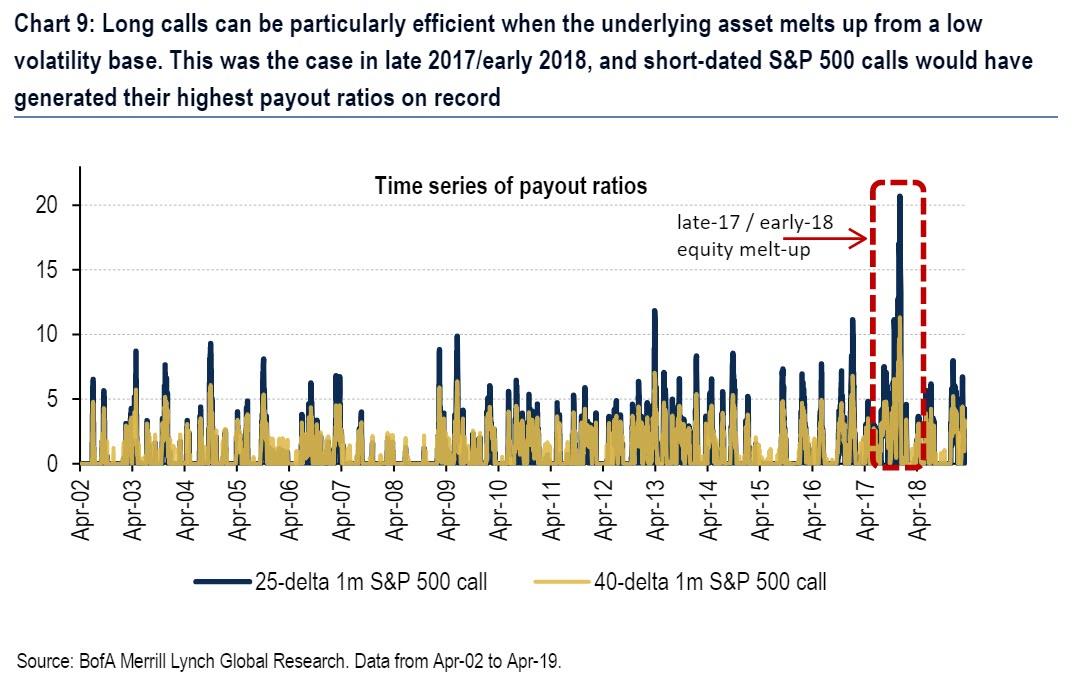
There is an additional kicker that makes this strategy especially lucrative: the recent collapse in the VIX.
Indeed, as shown in Chart 9, readers can see the efficacy of using calls to hedge the risk of an equity melt-up that starts from a low volatility base. What a backtest of this trade shows is that long SPX 1m calls achieved their highest payout ratios on record (data since Apr-02) in the Dec-17/Jan-18 “blow-off top” in US equities, returning between 10x to 20x depending on the exact parametrization.
Not bad for a trade which captures all the upside and is virtually not hurt by the resulting downside. Now the only question is “how can this trade blow up spectacularly.” Unfortunately, on that Bowler had nothing to share.
via ZeroHedge News http://bit.ly/2J2jq5o Tyler Durden