Submitted by DataTrek Research
Whenever equity markets hit an air pocket, as they did last week, we like to review US-listed exchange traded fund money flows. These come out daily, with a one-day lag, and offer a detailed look at where capital is moving in real time. While it is not a complete picture – mutual fund, hedge funds and retail are much less transparent – over the years we have found that ETF flows are a reasonable proxy for investor sentiment.
First, here is the top-of-house data (all ETF money flow information courtesy of www.xtf.com):
- For the 5 trading days through Thursday’s close, ETF investors redeemed $8.1 billion. That compares to weekly average inflows of $3.5 billion in 2019. Last week’s volatility therefore had the effect of reversing just over 2 average weeks of inflows. Notable, but not dramatic.
- Equity funds bore the brunt of the redemptions, with $7.6 billion of outflows. Average weekly inflows so far in 2019 are $1.3 billion. That means last week’s outflows reversed almost 6 weeks of typical 2019 inflows. Dramatic, in our book, but not yet severe.
- Fixed income ETFs saw inflows last week of $994 million. This is just shy of half the YTD weekly run rate of $2.1 billion. A modest slowdown, in other words.
- Precious metals ETFs had $545 million of outflows last week, almost 7x the average weekly redemptions ($80 million) so far this year. As with equities, that is a dramatic increase in outflows.
- Volatility-linked funds saw $549 million of outflows, a sharp reversal from average weekly inflows of $140 million. Given that there is just $3.8 billion in total assets under management here, vol funds clearly saw the worst of last week’s flows on a relative basis.
As for where that $7.6 billion of equity outflows came from:
- Most of it was out of US equities: -$6.7 billion
- The next largest chunk came from non-US developed economy markets: -$1.0 billion
- Emerging market equities actually saw small inflows: +$103 million
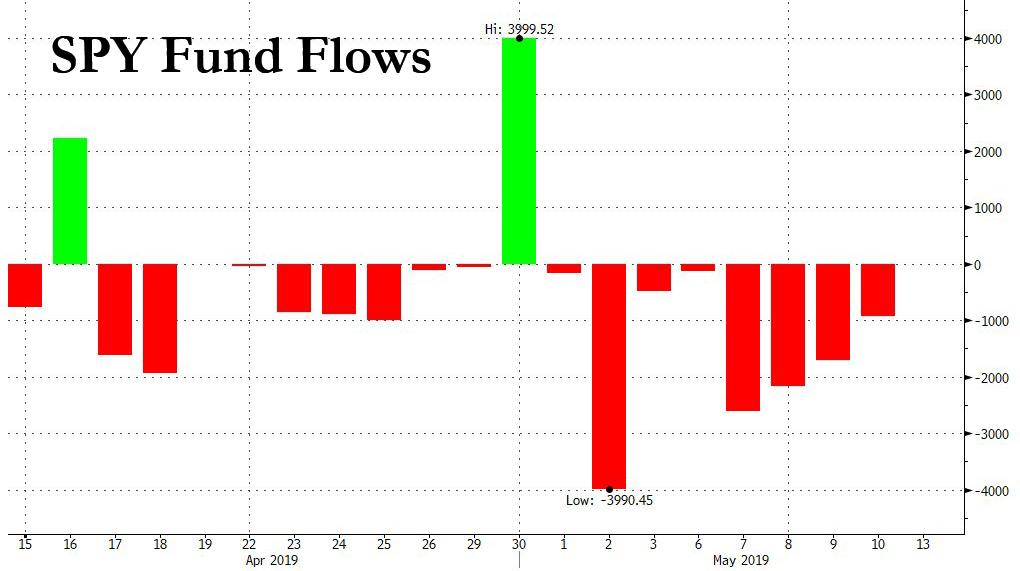
One notable development – the S&P500 ETF, better known as the SPY, saw outflows every single day this month!
Why this matters: while EM dramatically underperformed last week (-5.1% vs. -2.2% for the S&P), ETF investors did not throw in the towel. From a market sentiment standpoint, that’s not great news. You would want to see EM equity holders shove their way out of the asset class to signal a near term bottom. And we don’t have that yet.
Now, here is some color on the $944 million of fixed income inflows:
- ETF investors moved up the credit quality spectrum last week, with $816 million of outflows from junk-grade debt but $1.1 billion of inflows into investment grade corporates.
- They also shortened maturities on a relative basis, adding $983 million to funds with 0-5 year paper but just $179 million to ETFs +20 year average maturities. Both are notable departures from YTD weekly trends.
Why this matters: ETF investors are not just rethinking equity portfolio allocations – they are also reducing duration risk and improving the credit quality of their fixed income exposure.
Finally, a selection of US equity market cap-related and sector flows from the last week:
- Almost all the $6.7 billion in US equity outflows came from large caps ($6.6 billion). Mid caps saw $374 million of inflows and small caps had $1.0 billion of outflows. The balance was inflows into multi-cap funds.
- Technology saw $333 million of inflows, but this could easily have been hedge fund demand for shares to short against pre-existing single stock long positions. Almost all ($319 million) of this came from the creation of new XLK shares, the S&P 500 Tech sector ETF.
- Financials had $537 million of outflows, which makes sense considering hedge funds don’t typically play in this space so there would be less demand for ETF-based hedges.
- Health Care ETFs had $392 million of inflows – another sector with active hedge fund interest so hedging demand was likely high.
- Real Estate saw outflows of $348 million last week despite outperforming the S&P 500 with a 0.77% decline.
Summing up our thoughts on this weekly flow data: last week’s market volatility clearly pushed ETF investors to de-risk portfolios, but the flow data doesn’t suggest widespread panic just yet. As we have noted in past write-ups, ETF flows have gone from reliably strong to choppy in the last 6 months. As such, last week’s redemptions look more normal than they would have just 2-3 years ago. Despite equity flows turning negative, there’s nothing here to signal a near term low for market sentiment.
via ZeroHedge News http://bit.ly/2VBBbQs Tyler Durden
