Authored by Jesse Colombo via RealInvestmentAdvice.com,
Market volatility has reared its ugly head once again in recent weeks as the trade war with China took a turn for the worse and global economic data continues to weaken. On Thursday, the Dow lost 286.14 points, or 1.1%, the S&P 500 fell 34.03 points, or 1.2%, and the Nasdaq Composite dropped 122.56 points, or 1.6%. From a technical perspective, the S&P 500 is sitting just above a key support level at 2,800. The S&P 500 has bumped its head or bounced off of this levels quite a few times since early-2018. If the S&P 500 closes below 2,800 in a decisive manner, it would increase the likelihood of further downside.

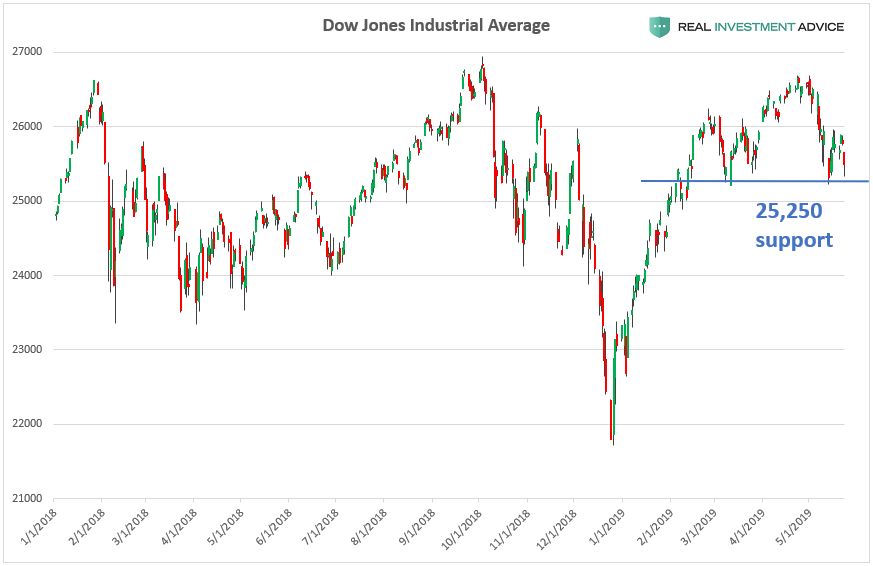
The Dow Jones Industrial Average is sitting just above its 25,250 support level that it has bounced off of in recent months. If the Dow closes below this level in a convincing manner, it may foreshadow even more downside action.
The tech-oriented Nasdaq Composite Index is just above its 7,600 support level that has come into play several times in the past year. If the Nasdaq closes convincingly below 7,600, further bearish action is likely.

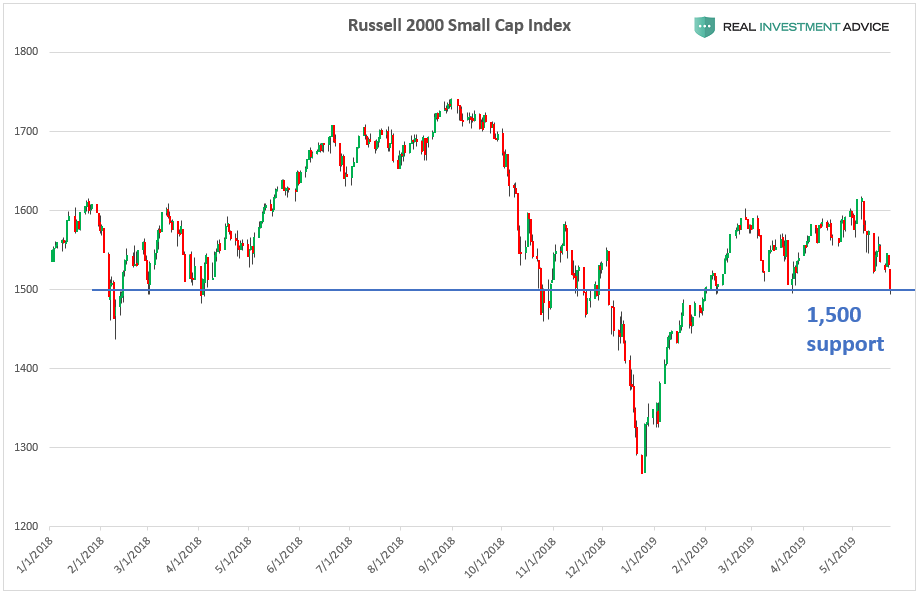
The Russell 2000 Small Cap Index closed just above its 1,500 support level. If it closes below this level, further weakness is likely.
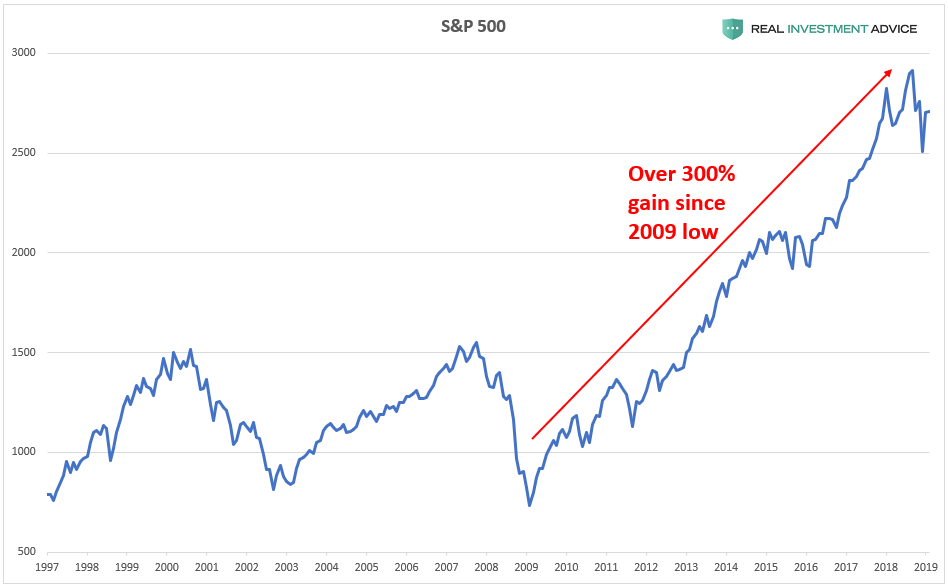
After the U.S. stock market’s 300% gain in the past decade (which is an unsustainable bubble), it is prudent to be aware of the risk of a sharp unwind:
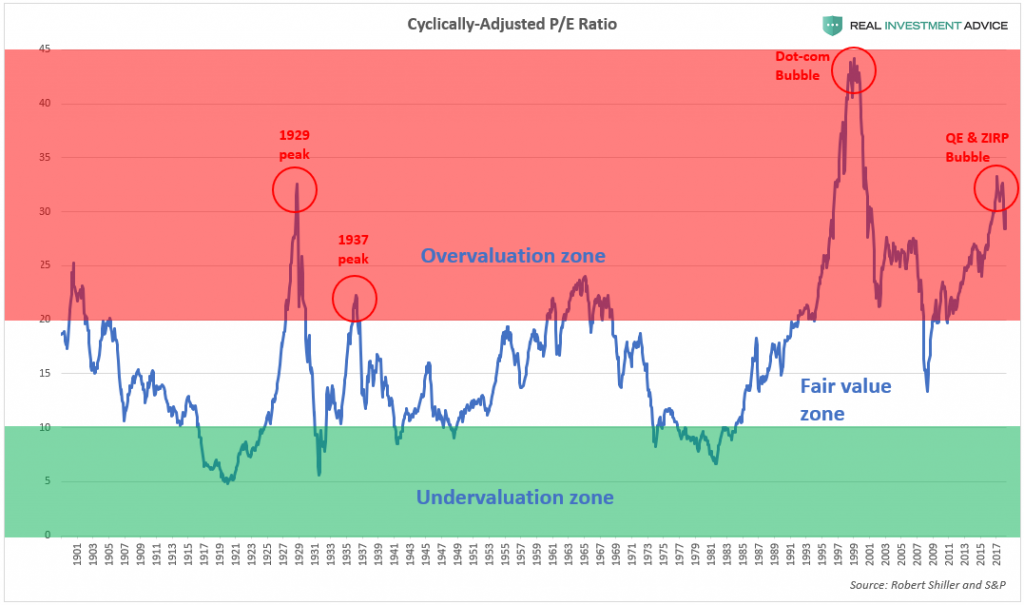
The S&P 500 rose much faster than earnings and is now at 1929-like valuations, which means that a painful correction is inevitable:
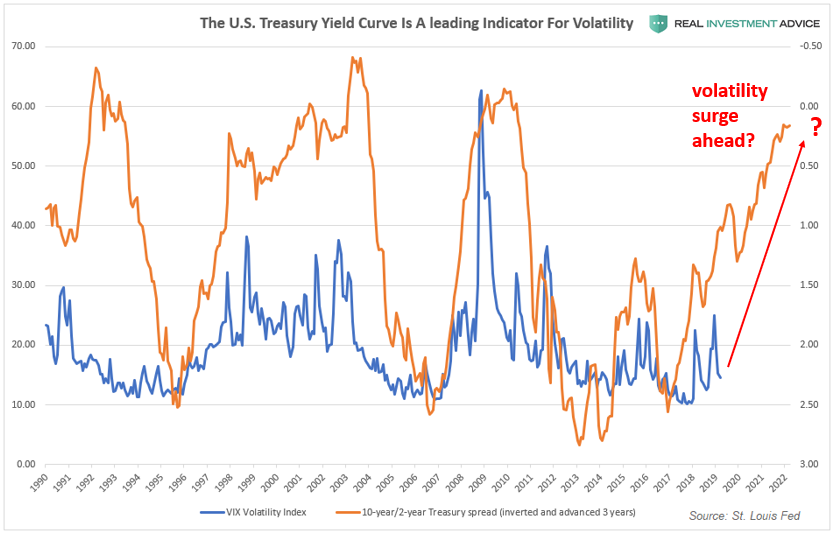
Another indicator that supports the “higher volatility ahead” thesis is the 10-year/2-year Treasury spread. When this spread is inverted, it leads the Volatility Index by approximately three years. If this historic relationship is still valid, we should prepare for much higher volatility over the next few years. A volatility surge of the magnitude suggested by the 10-year/2-year Treasury spread would likely be the result of a recession and a bursting of the massive asset bubble created by the Fed in the past decade.
For now, I am watching how the major indices act at their key support levels. If the indices break their supports at the same time that the trade war worsens even further, we could see another sharp sell-off like the one in late-2018.
via ZeroHedge News http://bit.ly/30Ju4V5 Tyler Durden