The Fed (and Larry Kudlow)’s favorite recession indicator is flashing even ‘redder’ this morning with the spread between 3m and 10Y US yields tumbling to -13bps…

The most inverted since July 2007.

It seems every time The Fed speaks, the yield curve collapse accelerates, and critically, as Jim Grant noted recently, the spread between the 10-year and three-month yields is an important indicator, James Bianco, president and eponym of Bianco Research LLC notes today. On six occasions over the past 50 years when the three-month yield exceeded that of the 10-year, economic recession invariably followed, commencing an average of 311 days after the initial signal.
However, if that’s not worrisome enough for you (and the CNBC plunge protection team has left you believing its different this time), Morgan Stanley’s Michael Wilson warns that adjusting for QE (and QT) things are considerably worse.
When translating the adjusted Fed Funds rate into the yield curve by making the exact same adjustment to the 3 month T-Bill given the historical nearly 100 percent correlation, the result can be seen below.
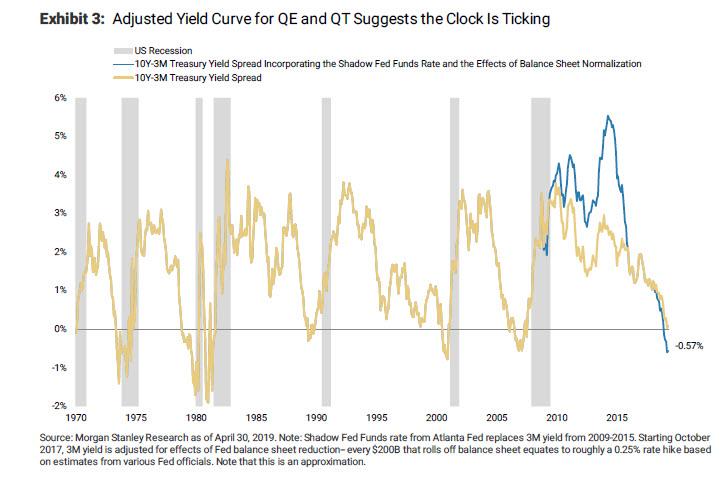
The light blue line is the unadjusted 10 year – 3 month yield curve and the dark blue line shows what it would look like fully adjusted for QE and QT. The adjusted curve shows record steepness in 2013 as the QE program peaked, which makes sense as it took record monetary support to get the economy going again after the great recession. The amount of flattening thereafter is commensurate with a significant amount of monetary tightening that is perhaps underappreciated by the average investor.
More importantly, unlike the unadjusted curve which only flipped negative in March, the adjusted yield curve inverted last November and has remained in negative territory ever since, surpassing the minimum time required for a valid meaningful economic slowdown signal. It also suggests the “shot clock” started 6 months ago, putting us “in the zone” for a recession watch, according to Wilson. As a result, Morgan Stanley thinks the bond market has it right to suggest the next move for the Fed will be a cut. Incidentally, the equity market is also right, given how defensively it has traded since last summer. Furthermore, the curve inverted about the same time the trade truce happened in late November and has stayed inverted despite all the positive rhetoric earlier this year around a trade deal. This means the US economic slowdown and rising recession risk is happening regardless of the trade outcome
Summarizing Wilson’s “adjusted yield curve” observations:
-
The adjusted yield curve inverted last December rather than in March, and it’s remained well below 0% even since.
-
It looks like it may be bottoming which is typically the beginning of the end for the economic cycle.
But apart from that, everything is awesome, “and we’re just a few percent below record highs” right?
via ZeroHedge News http://bit.ly/2WqegHJ Tyler Durden