It’s probably a coincidence but on the day we warned that the hedge fund “redemption rush” returned, just ahead of news that UK’s Neil Woodford has blocked redemptions from his £3.7bn equity income fund, that the broader L/S hedge fund community suffered what Nomura calculated was a beating on par with the worst day of 2019.
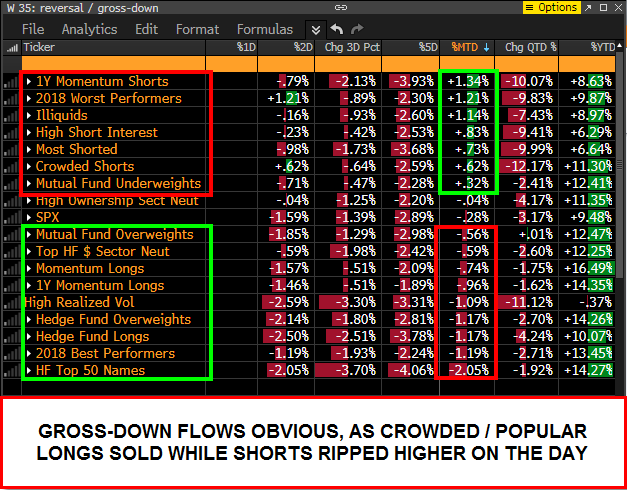
Specifically, as Charlie McElligott writes this morning, after an extended period of outperformance for long/short hedge funds, “thanks to grossed-up shorts having done their jobs–along with “low nets” that come with them”, yesterday’s below the hood behavior was “outright ugly”, and according to the Nomura strategist was “tied for the worst performance day YTD for his model Equities L/S HF (-1.7% on the session) in classic “gross-down” fashion”, as crowded cyclical shorts exploding higher on forced covers (Materials +3.4%, Energy +1.4%, Industrials +0.7%, Financials +0.7%) while crowded longs – recall our Sunday article “These “Most Crowded Stocks” Face The Greatest Risk Of Wipe Out” which again was published at just the right time – were destroyed (Cons Disc -1.2%, Tech -1.8%, Comm Services -2.8%, Software 8x’s EV/Sales -5.2%) — and as such, “it was rationally the worst day for 1Y Price Momentum factor (-2.3% on session) in nearly two months.“
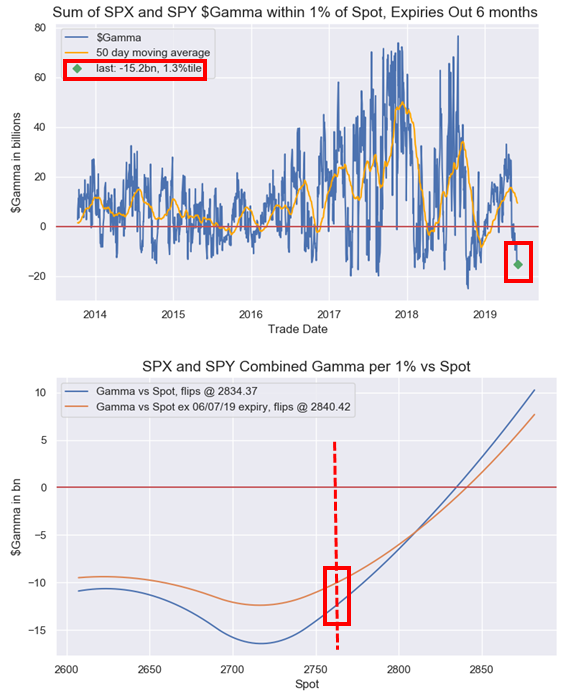
A separate reason for yesterday’s meltdown in hedge fund favorite stocks was the “extreme gamma” positioning we discussed yesterday morning. As Nomura explains, yesterday’s overall Equities trade “was the exact chop-fest you should expect with the “extreme Gamma” market (sum of SPX / SPY $Gamma currently just 1.3%ile since 2013), featuring a 22 handle opening selloff, followed by a 26 handle rally, before a later 30 handle selloff, before another 20 handle rally, a 20 handle selloff, a 15 handle rally, a 25 handle selloff and a 15 handle rally into the cash session close.”
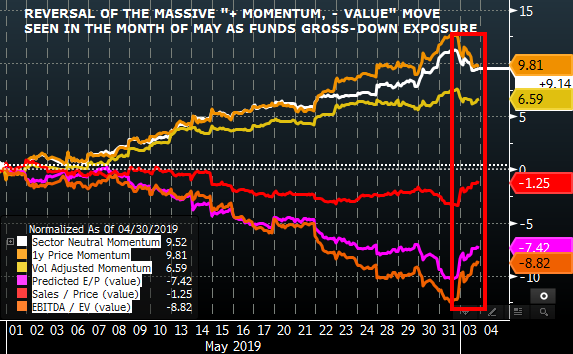
Meanwhile, another way of looking at yesterday’s massive rotation, is that as has been the case frequently in the past, “the big performance drawdown days for US Equities funds continue to come when chronically underweighted / structurally shorted “Value” factor squeezes / rallies against the enormous length crowded into “Growth” factor, which has been accumulated as a duration-sensitive alternative to traditional Defensives”, according to McElligott, and yesterday “was the largest “Value / Growth” ratio reversal higher since late Nov 2016…although nary just a micro-move relative to the decade-long “Growth over Value” phenomenon since the GFC and QE began.”
Said another way—“expensive” Growth stocks were purged (on the somewhat idiosyncratic anti-trust escalations) while “cheap” and heavily-shorted Value stocks were covered—which although only being one day’s worth of behavior IS notable, because it mimics pre-recessionary behavior where Value factor L/S sees signs of life, as Value Shorts (aka expensive Growth Longs) break down first, before Value Longs (aka Cyclicals) begin to outperform on sensitivity to perceived Fed easing / stimulus coming down-the-pipe
As McElligott shows in the chart below, yesterday was the partial unwind/gross down of much of May’s “slowflation” rally in which momentum soared (long growth and defensives, short cyclicals) while value was hit as a result of the trade war growth scare.
Going back to Monday’s hedge fund hammering, McElligott also notes that when the “Value/Momentum” reversal ratio spikes as it did yesterday, a sharp equities hedge fund performance drawdown follows, something which Neil Woodford is all too familiar with.
Discretionary funds aside, one final observation is what CTAs are doing and about to do. Following on our report from last night that CTAs are now shorting the Russell 2000, and it is only a matter of time before they turn short on the S&P 500, McElligott writes that his own CTA model has seen systematics also “flip short” the NASDAQ (if within range of cover), while CTAs on S&P are in no man’s land: 30 points below re-leveraging levels (2,791 to get to 82% net long), and 25 handles above the 2,735 de-leveraging level to -100% Short”
S&P 500, currently 67.7% long, [2749.6 close yesterday, spot currently 2760], more buying over 2791.31 (+1.52%) to get to 82% , max long over 2938.32 (+6.86%), selling under 2735.48 (-0.51%) to get to -16% , more selling under 2735.2 (-0.52%) to get to -100% , flip to short under 2735.48 (-0.51%), max short under 2735.2 (-0.52%)
And with the S&P now withing close proximity to both buy and sell trigger points for the CTA community, Nomura makes these final observations:
- The positioning across Global Equities has tilted boldly “Short”
- The Bonds/Front-End “Long” remains massively in-the-money
- USD remains a “+100% Long” across all nearly all pairs
- Commodities are off the extreme “-100% Short” of last month, with Metals tilting “Neutral to Long,” with Crude “Neutral” and Ag products generally still “Short”
And visually:

via ZeroHedge News http://bit.ly/2Z7KiGa Tyler Durden