When we commented yesterday on the latest positioning among the systematic community, we paraphrased Nomura’s Charlie McElligott, who wrote that his CTA model had seen systematics “flip fully short the NASDAQ while CTAs on S&P were in no man’s land: 30 points below re-leveraging levels (2,791 to get to 82% net long), and 25 handles above the 2,735 de-leveraging level to -100% Short.”
Well, what a difference a day makes: with CTAs all beared up after the US was reportedly set for an anti-trust crackdown against Amazon, Facebook, Apple and Google, Tuesday’s violent short-covering reversal, has left all the algos, which as we said yesterday were in no man’s land, scrambling, and as McElligott updates today, CTAs have completely reversed their bearish dip, and are now “+97% Long” after being “-100% Short” yesterday.
More details from McElligott who notes today that the Nomura QIS CTA model “showed SIGNFICANT $ buying/covering yesterday across key SPX- (re-leveraging the “Long”) and NDX- (quickly covering the prior day’s “Short”) Futures positions with both now posting a “+97% Long” signal”:
- SPX model estimates nearly $21B Futures to BUY after clearing the 2791 trigger—the signal is now all the way back to “+97% Long” as the 3m window “flips” Long again
- Perhaps just as important was that the prior day’s Nasdaq Futures “-100% Short” was immediately “stopped-out” after clearing 7133 yesterday and also trigger a “flip” in the 3m window, with an estimated ~$20B of Futures buying—the Nasdaq model signal now too stands at “+97% Long”
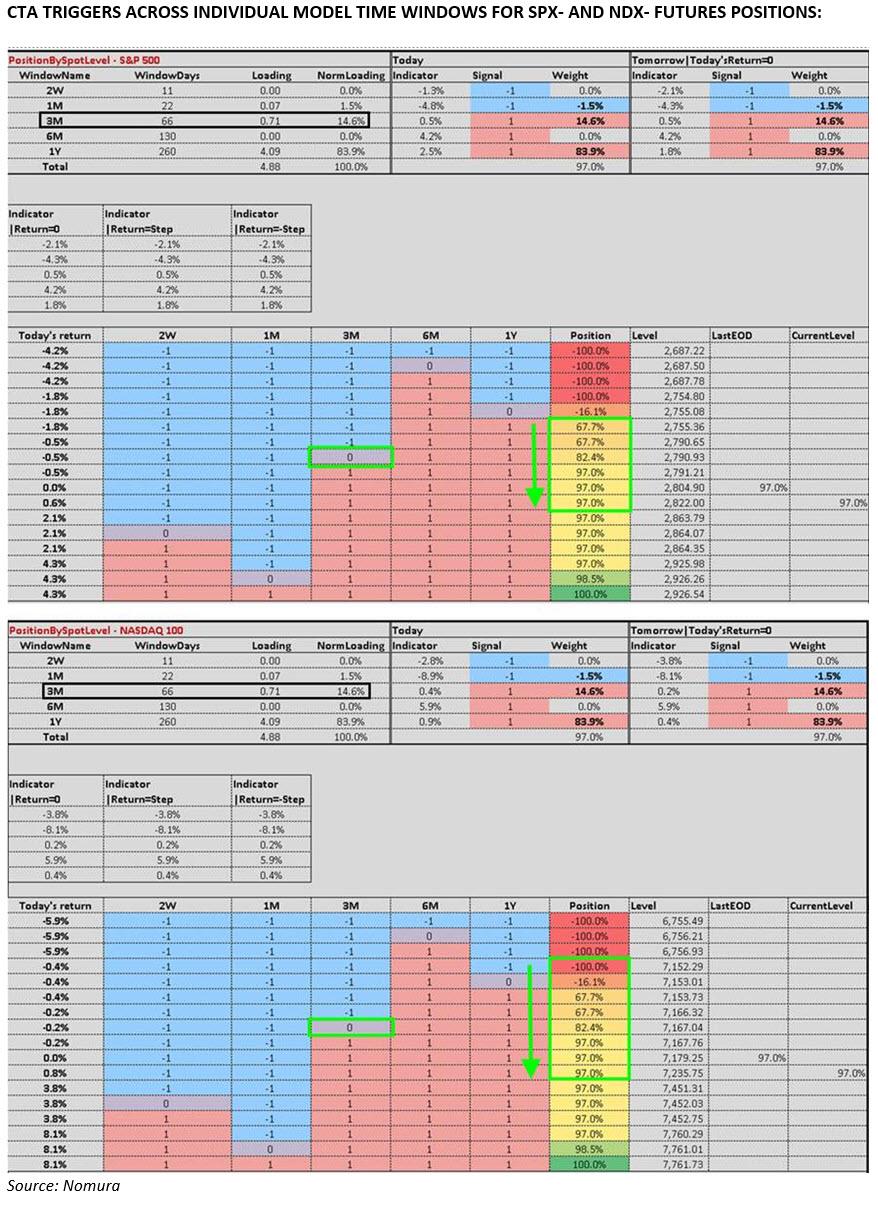
So what are the latest CTA trigger levels according to Nomura? Here is the full breakdown:
- NASDAQ 100, currently 97.0% long, [7179.25], more buying over 7761.01 (+8.10%) to get to 99% , max long over 7761.73 (+8.11%), selling under 7167.04 (-0.17%) to get to 82% , more selling under 7152.29 (-0.38%) to get to -100% , flip to short under 7153.01 (-0.37%), max short under 7152.29 (-0.38%)
- S&P 500, currently 97.0% long, [2804.9], more buying over 2926.26 (+4.33%) to get to 99% , max long over 2926.54 (+4.34%), selling under 2790.93 (-0.50%) to get to 82% , more selling under 2755.08 (-1.78%) to get to -16% , flip to short under 2755.08 (-1.78%), max short under 2754.8 (-1.79%)
What is most interesting is, just like yesterday, how narrow – less than 40 points – the range between the Max Short (2,754) and 97% Long (2,791) on the S&P is. This explains why the market will likely whipsaw violently any time it drops inside this corridor.
The full CTA trigger breakdown below:
via ZeroHedge News http://bit.ly/2IjGhaU Tyler Durden