“Buy the dip” or “sell the rip.”
That is the question for countless stock traders everywhere, and for Goldman’s Christian Mueller-Glissman, who admits that Goldman’s tactial position has been “relatively defensive” in its asset allocation for 3 months, with a N rating on Equities and Credit, UW Bonds and OW cash (even it it remains “modestly pro-risk and remain OW Equities” over the next 12 months). Thus, the Goldman strategist writes, like many investors right now, he is “looking to ‘buy the dip’. But while buying the dip has been a successful strategy since the GFC, “it only works when drawdowns recover quickly and are not getting deeper.”
To be sure, just like following the December massacre, May’s rout – which sent the Nasdaq into a brief correction – did recover following a torrid start to the month of June, with the best weekly return in years thanks to easier monetary policy which was the main support for risk appetite YTD and helped anchor equity volatility. However, as Goldman writes, “with weaker US growth and still elevated valuations, drawdown risk has increased” and as Mueller-Glissman adds, “in contrast to the sharp drawdown in Q4 2018, the asymmetry for equity returns has not improved much.”
As a result, Goldman looks at signals from volatility, valuations and its Risk Appetite Indicator to assess the risk of further drawdowns, and concludes that “without a constructive view on growth left tail risk still appears elevated.”

Here’s the problem in a nutshell:
For the first time in years, the centrally-manipulated market held true to conventional axioms and in line the old saying of “sell in May and go away” equities declined sharply in May due to rising global growth concerns, fueled by escalating US trade tensions with China and Mexico, and worries about falling rates and fading support from central banks, which has been a key driver of risk appetite in Q1. In fact the S&P 500 return for the month of May was the worst since the flash crash of May 2010 and before that May 1962.
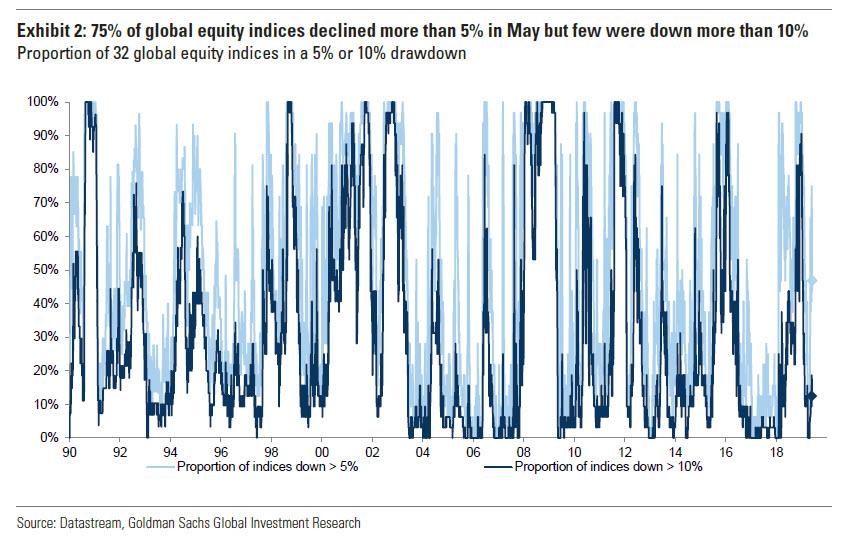
Yet in a testament to the market’s stubborn ascent, most markets drawdowns have been relatively small so far – only 16% of equity markets had a drawdown of more than 10% (Exhibit 2). EM equities, in particular Turkey and China, had the largest drawdowns but Japan also underperformed and the Nasdaq was down 10% (with FANG+ dipping into a bear market), both due to US/China trade tariffs and antitrust investigations.
So does that mean it is once again safe to BTFD?
Well, as Bank of America first pointed out back in 2017, when its strategists showed that central banks have always stepped in when the market was on the verge of a bear market…

… since the financial crisis, “buy the dip” has generally been the right strategy in response to any 10% drawdown of the S&P 500. The average subsequent returns (especially shortly afterwards) from simply buying the S&P 500 after a 10%+ dip were higher than the average since 2010 – hit ratios were also higher (Exhibit 3).
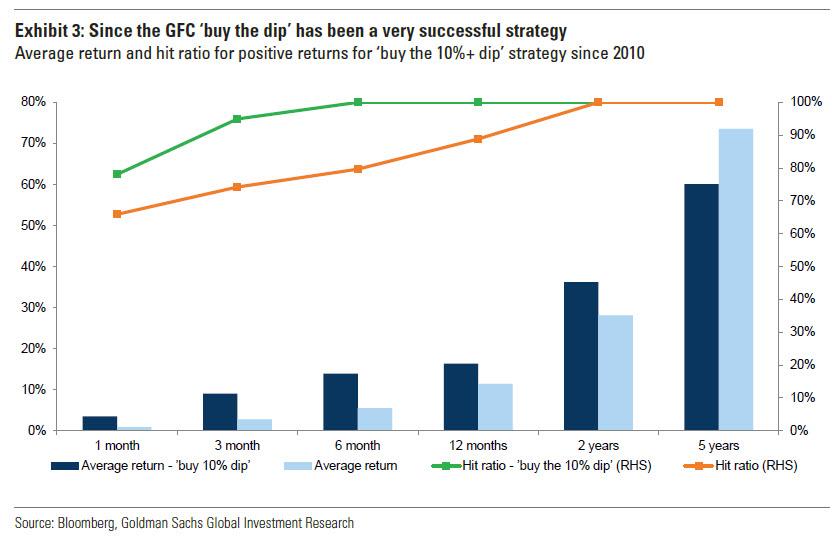
However, 5-year returns suggest that by just buying the dips investors missed out on some very strong return periods without any drawdowns. But the success of ‘buy the dip’ also meant that strategies selling insurance on equities, such as put selling, had strong risk-adjusted returns.
One reason a ‘buy the dip’ strategy for the S&P 500 has been successful is that since the GFC there have not been deep, long-lasting drawdowns (as central banks would immediately intervene… just like this time), which is when such a strategy becomes particularly dangerous.
Indeed, as even Goldman now admits, “in the last three large S&P 500 drawdowns a combination of monetary and fiscal stimulus helped stabilize growth and financial conditions and thus markets.” Translation: markets no longer exist, as they have been replaced with “markets” that serve a political purpose to boost consumer confidence no matter the cost.
Yet with global growth falling since 2018, leaving less scope for monetary and fiscal easing and lingering equity volatility “buy the dip” appears increasingly risky and instead it might be time to ‘sell any rip’ as drawdowns could become larger and last longer.
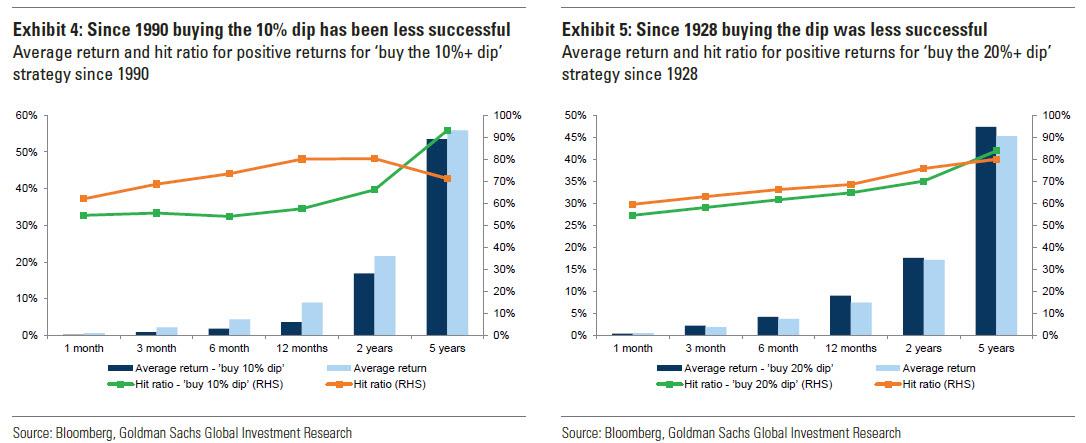
Indeed a simple ‘buy the dip’ strategy for the S&P 500 since 1990 (Exhibit 4), which includes 2 bear markets and several larger drawdowns, has worse near-term returns and hit ratios. Only a ‘buy the dip’ strategy for larger than 20% drawdowns has average returns and hit ratios marginally better than unconditional ones – and mainly for longer time horizons (>2-year), “which means investors might face losses first”, according to Goldman in a dreadful warning to a generation of investors who have never seen a bear market.
The same is true for a ‘buy the 20%+ dip’ strategy since 1928 which has been even less successful (Exhibit 5) – there is a small improvement in returns but hit ratios only improve over very long horizons. This illustrates the problem when consistently buying the dip – ex ante it is difficult to know how deep a dip will become and if a deep bear market, which can result in major losses that take very long to recover, will be avoided.
Meanwhile, economic imbalances and market instability is building up. While one can debate whether the market’s brief dip below 20% on Dec 24 from its prior all time highs was a bear market (most analysts seem to ignore that for at least a few minutes on Christmas Eve 2018, the S&P did indeed cross into a bear market), the equity cycle is still the second longest since 1928 without a bear market (>20% drawdown) in the S&P 500 (Exhibit 6), only beaten by the very strong bull market in the 1990s.
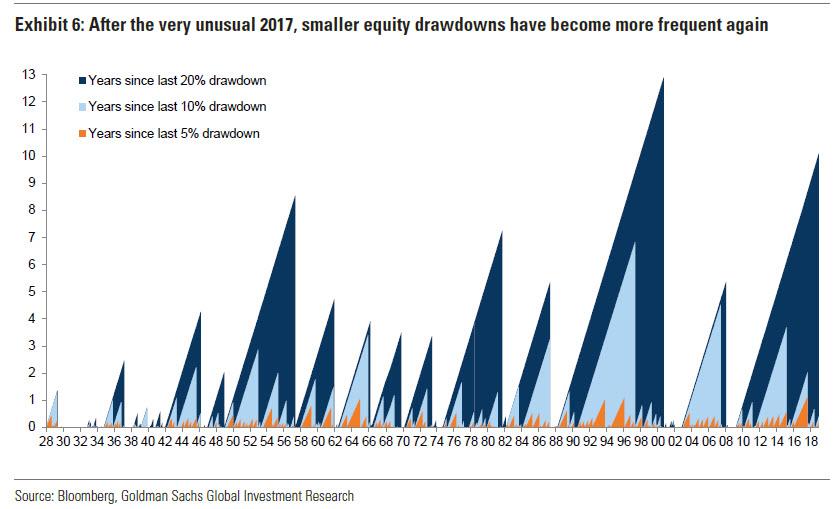
On the other hand, as the Goldman chart above shows, there has been three large S&P 500 drawdowns since 2009 that came relatively close to a bear market: (1) the Euro area crisis in 2011 with 19.4%, (2) the EM/oil crisis in 2015 with 14.2% and (3) the drawdown in Q4 2018 came very close with 19.8% on a closing basis (though more than 20% intraday). And while the S&P 500 may or may not have narrowly avoided a bear market last year, more than half of global equity indices did not, making a ‘buy the dip’ strategy more painful early on.
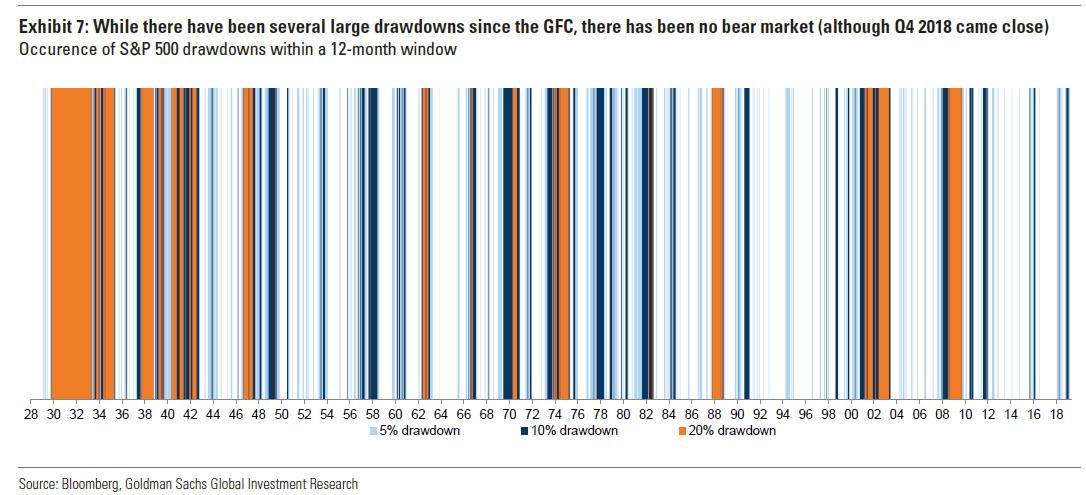
Not only that, but following the record low vol 2017, in 2018 equity drawdowns became far more frequent with one in February, March and Q4 (Exhibit 7). This was a dramatic reversal from 2017 when volatility had all but died and which set the record of the longest stretch without a 5% drawdown since 1928. Drawdowns of more than 10% (but less than 20%) are not uncommon (we found 36 since 1928) – the average correction peak to trough is 13% and lasts 3 months (with the recovery to previous levels lasting 4 months). Bear markets (drawdown >20%) has been less frequent with 14 since 1928 – the average drawdown peak to trough is 41% and lasted 20 months (with the recovery to previous levels lasting much longer with 42 months).
Besides technicals, equity drawdown risk is higher with elevated valuations, as there is less cushion to absorb shocks, and late cycle, which increases the risk of growth or inflation shocks. Elevated S&P 500 Shiller P/Es were often followed by larger equity drawdowns in the subsequent 5 years. This is a problem because currently, US Shiller P/Es are at 30x, up c.126% since March 2009 and at the 95th percentile – they have never been higher outside the Tech Bubble of 2001 and 1929, which were followed by two of the biggest equity bear markets in history.
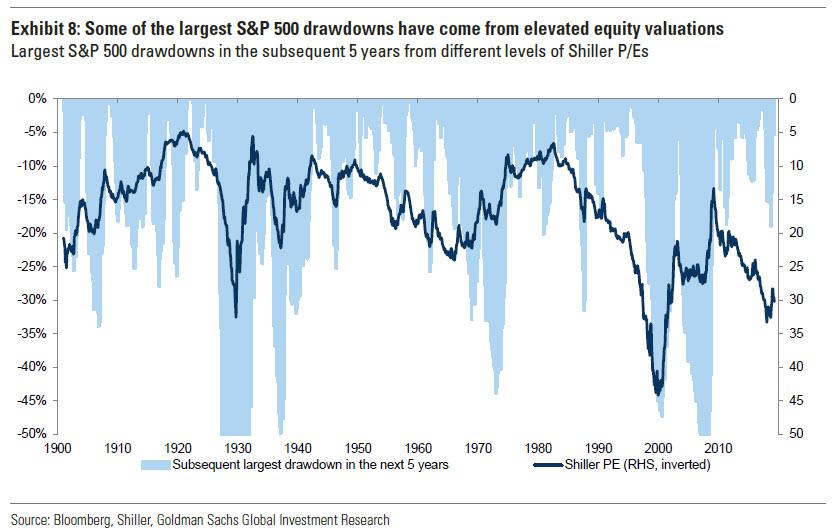
That is Goldman’s way of saying that based on fundamentals/valuations, things will get much uglier soon.
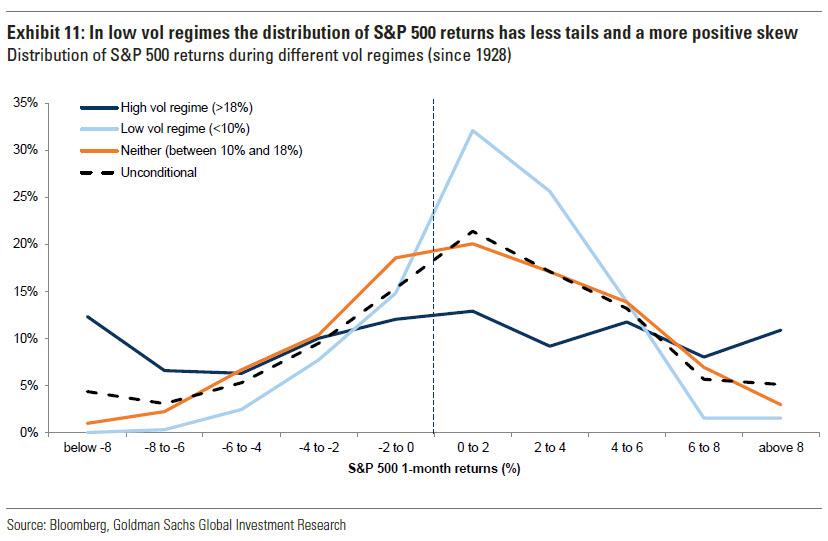
In addition to technicals and fundamentals, the VIX is also a key factor, as most of the large S&P 500 drawdowns since 1928 have been in periods of high volatility. S&P 500 1-month volatility has been 15% on average but it varied materially – the 75th percentile was 18% and the 25th percentile was 10%. Low and anchored volatility signals stable or improving macro conditions which are supporting risk appetite – on the flipside elevated volatility indicates increased tail risk, according to Goldman.
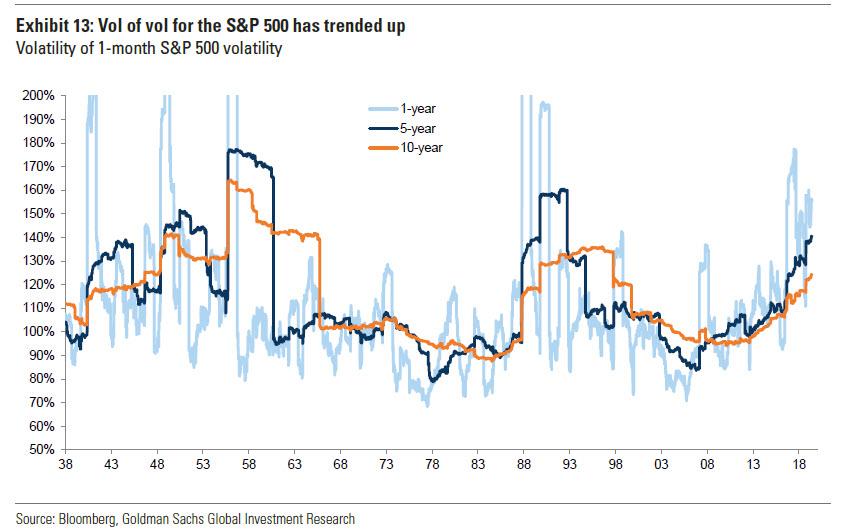
Yet even here the broken market – this time a result of the widespread penetration of HFTs – can send false signals as vol of vol has increased materially in recent years, exacerbating drawdowns. In other words volatility changes are larger and faster than they used to be, in part due to changes in the market microstructure. In fact the 1-year rolling vol of vol is close to the levels from 1987 (Exhibit 13), which suggests higher risk of large vol spikes from low vol levels, such as February 2018. Large vol spikes also reverse more quickly: January 2019 was one of the largest and fastest vol declines since 1928 – investors that would have been cautious due to high volatility alone would have been underinvested in the Q1 recovery.
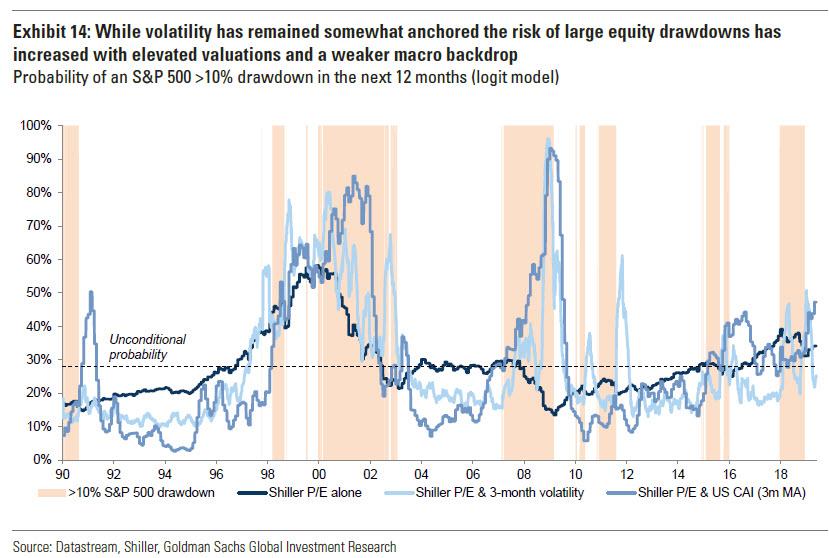
Combining the last two observations suggest that equity drawdown risk increases with higher volatility and weaker growth. To Goldman, one way to combine the signals is a model that relates the risk of a 10% S&P 500 drawdown over the next 12 months to levels of Shiller P/E and realized volatility (Exhibit 14).
As Goldman notes, currently, a purely valuation-based signal indicates somewhat elevated risk of a 10% drawdown but adding the 3-month S&P 500 volatility, which remains relatively low, still suggests a below average probability. But of course volatility can be a lagging signal as it often increases sharply during a drawdown (and usually peaks close to the end) and there is the problem of false signals because of rising vol of vol.
If one adds a fundamental variable, such as Goldman’s Current Activity Indicator, helps to further assess drawdown risk. Weak US growth increases the risk of a S&P 500 drawdown – with our US CAI declining to 1.7% in May, the estimated probability of drawdown is now at the highest level since the GFC. Here it’s worth noting that not every market crash is driven by the US business cycle alone – the interaction with monetary policy matters and there can be global shocks (e.g. the Asian Financial Crisis/Russian Default/LTCM in 1998 or the Euro area crisis in 2011).
So with all these risk factors in mind, Goldman has laid out three core signals to aid its clients in deciding when to “buy the dip” (or “sell the rip”).
But first, a couple of big picture observations: as Goldman confirms, monetary policy has been the key support for risk appetite YTD and again this week with dovish comments from Fed chair Powell and the ECB’s T-LTRO announcement. But prospects for additional central bank stimulus appear limited – Fed pricing is already very dovish – and as a result better growth will become more important to stabilise equities and risk appetite more broadly. But, as Goldman concedes, due to structural and cyclical headwinds the potential for a strong pick-up in growth seems more limited. Potential support could come from aggressive fiscal stimulus in the US, e.g. infrastructure, or China and of course a de-escalation of US trade tensions.
To summarize, when buying the dip investors need to take a view on forward macro fundamentals to assess further downside risks. Here are the 3 signals that should help investors decide on when to ‘buy the dip’:
1. Volatility at very high levels (and a high probability of a low vol regime)
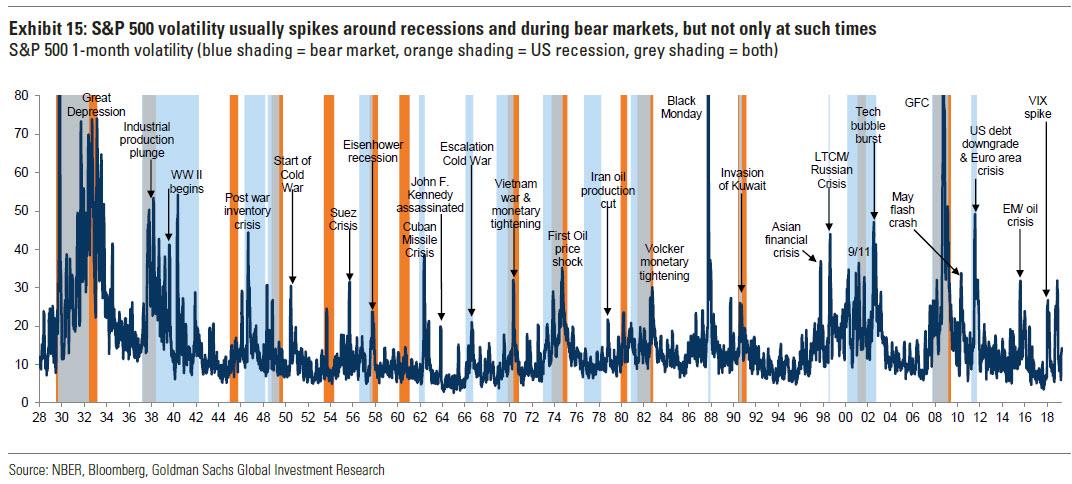
From very high levels of S&P 500 volatility and/ or large spikes the asymmetry of returns in the medium term often improves as markets often overshoot. Since 1928, large volatility spikes usually indicate a deep drawdown and volatility was elevated in most bear markets and recessions (Exhibit 15).
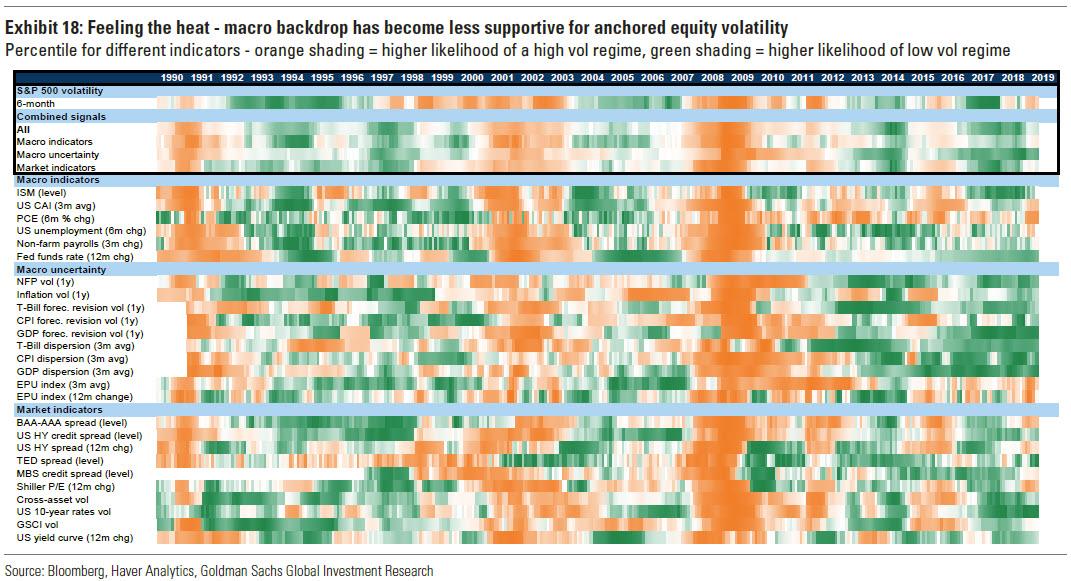
Additionally, a shift to a high vol regime is more likely with a weaker macro backdrop, which makes risky assets more vulnerable to shocks. Goldman’s vol regime heatmap tracks the key drivers of vol regimes – while for most of 2018 the macro, macro uncertainty and markets indicators were still very supportive to anchor S&P 500 volatility, US growth has softened, the yield curve has inverted and policy uncertainty has picked (Exhibit 18).
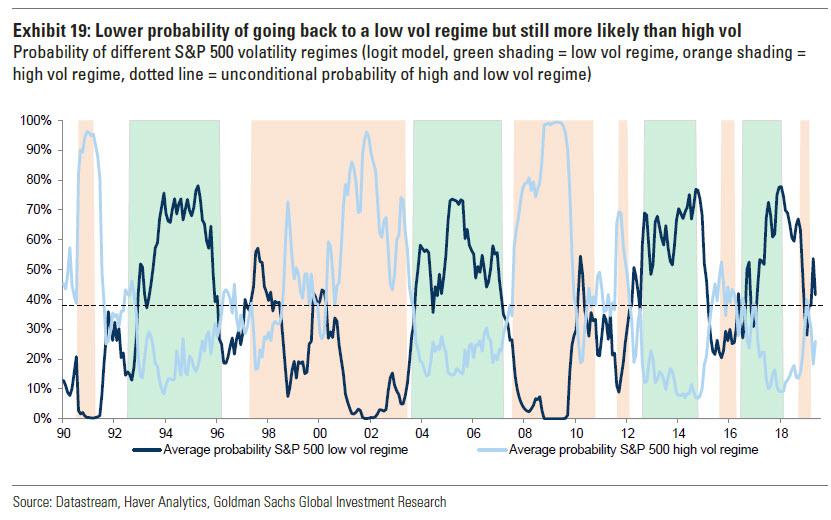
For what it’s worth, vol regime probability model also indicates a lower probability of going back to a low vol regime (Exhibit 19). Still, according to Goldman, the likelihood of a high vol regime is still relatively low and well below the unconditional probability, anchored by relatively low cross-asset volatility and credit spreads. However, while Goldman’s model gives confidence on mean reversion at extremes it struggles to anticipate regime shifts.
The bottom line is that subsequent S&P 500 6-month returns can still be very negative after large vol spikes with several 20%+ drawdowns. Having said that, a low vol regime probability above 30% indicates lower left tail risk (Exhibit 20). Currently a dip alongside a S&P 500 1-month vol spike above 25% should be bought – however, the recent sell-off has been with low volatility (indicating less overshoot to the downside) and macro fundamentals are weakening, lowering the probability of a low vol regime.
2. Large and sharp valuation de-rating in equities (without a profit recession expected)
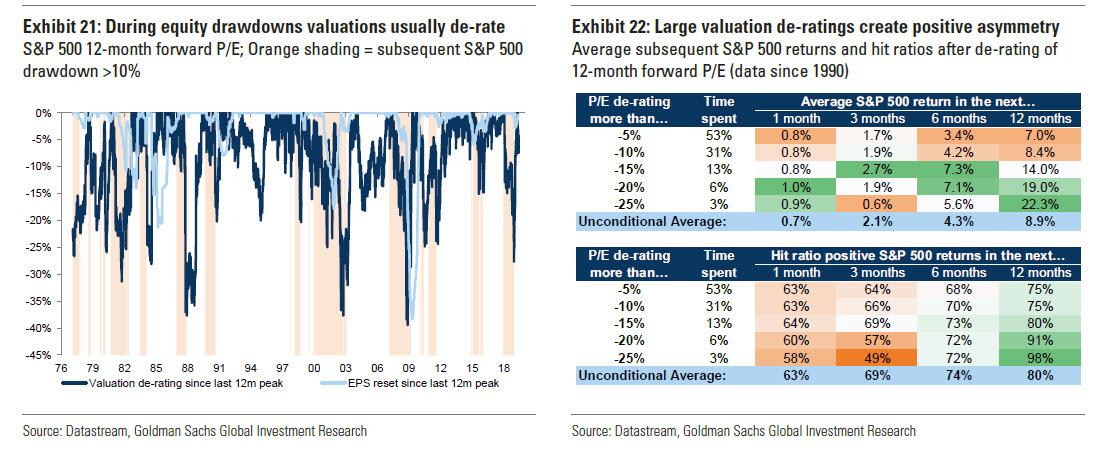
As Goldman claims, ‘Buy the dip’ can also be less risky after a large valuation de-rating, which improves the asymmetry of returns. The valuation reset in Q4 2018 was one of the largest since the 1970s, indicating that material risk to earnings was discounted (Exhibit 21). Often equity valuations de-rate ahead of profit recessions but tend to overshoot – in several cases subsequent earnings declines were relatively small. Valuation de-ratings >15% tend to improve average returns and hit ratios on a 12-month horizon (Exhibit 22).
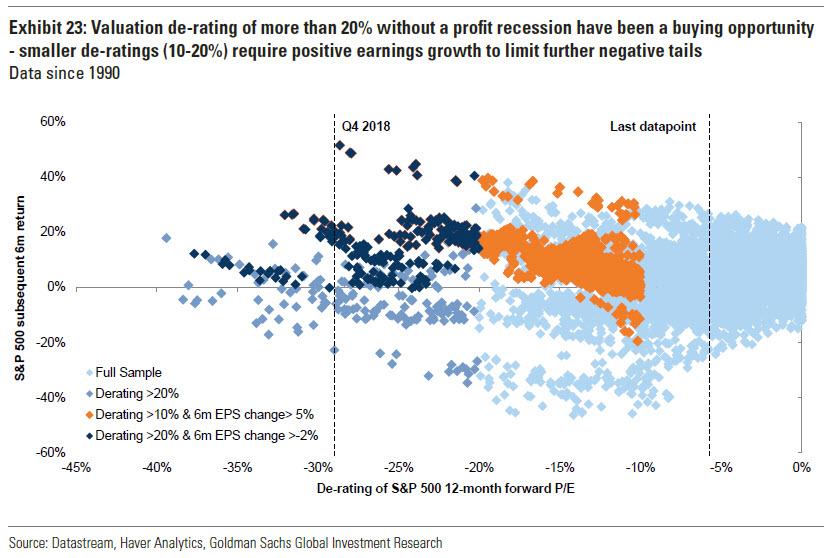
Near-term returns can again be mixed – on a 6-month basis there can still be large S&P 500 drawdowns (20%+) even after large valuation de-ratings. However, in case of a >20% de-rating and if no profit recession is expected, the asymmetry is quite positive. In case of smaller de-ratings (10%-20%) investors can consider buying the dip if they expect earnings growth to remain positive. However, the recent valuation de-rating is small and earnings revisions have been negative across markets YTD.
3. Risk appetite indicator at very negative levels (but no US recession expected)
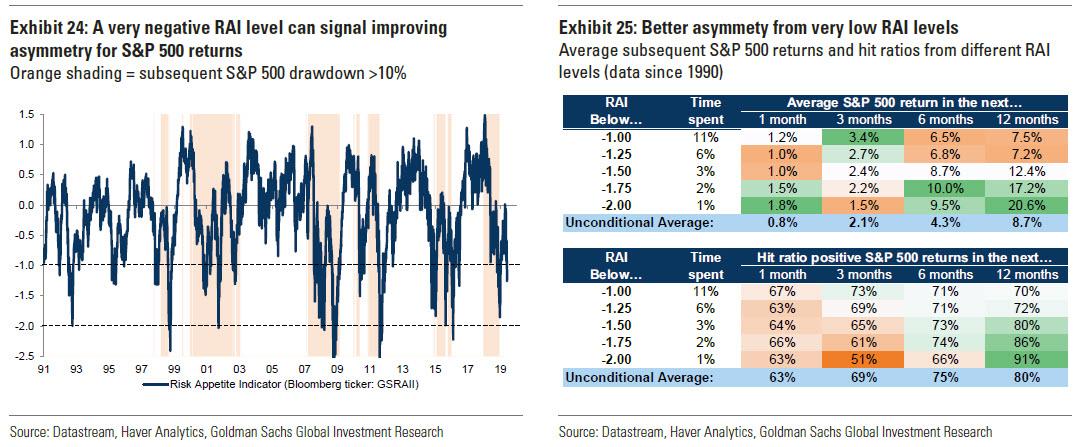
From very bearish levels of Goldman’s Risk Appetite Indicator (RAI), the asymmetry of S&P 500 is turning positive. The bank’s RAI signals the potential for a recovery over the next 12 months when it reaches extremely low levels below -1.5, with levels closer to -2.0 giving the clearest signals.
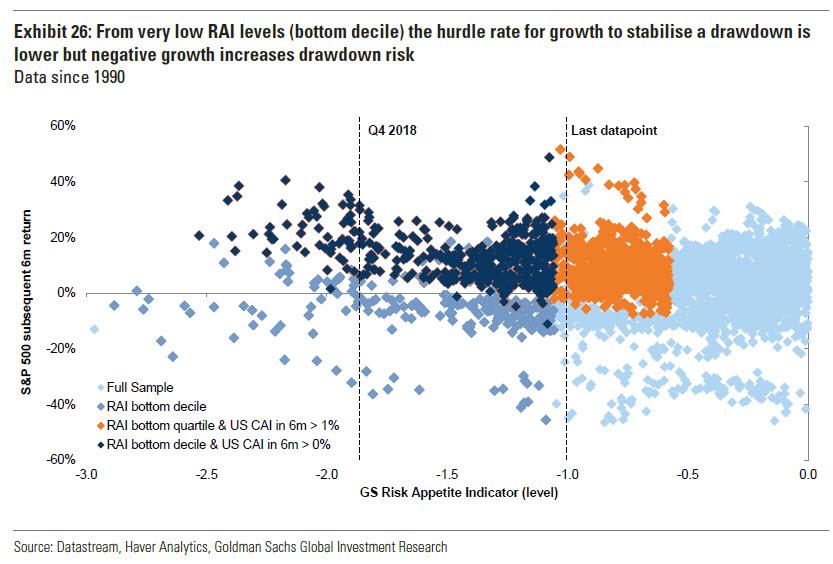
But again results for near-term returns, like 3- and 6-month, are more mixed. Even from very negative RAI levels there can still be larger drawdowns. However, if a US recession in the next 6 months can be avoided (US CAI in 6m >0%), investors should consider buying the dip, even with a shorter horizon. That’s why the market has spiked in June as Powell flipped from a “patient” Fed to a dovish one, with a rate cut now actively contemplated.
If the RAI is in the bottom quartile, expected US growth needs to be well above 1% to cap left tail risk. With the RAI not very negative currently and high uncertainty on US growth due to the US/ China trade tensions, there is no strong signal to ‘buy the dip’. In addition there is a large gap between risk appetite in ‘risky’ and ‘safe assets’ due to the boost from monetary policy – the RAI excluding safe havens is only at -0.75.
Conclusion
As Mueller-Glissman observes, a lot of investors have low allocations to equities and are keen to ‘buy the dip’ but near-term equity drawdown risk remains elevated until US and global growth picks up – until then markets remain vulnerable to shocks from politics if monetary policy disappoints. Indeed, Goldman’s economists expect US trade tensions to linger, tech is likely remain volatile due to antitrust concerns, Italy political risk and Brexit uncertainty has picked up again.
And these are only the known unknowns – there is always risk of unanticipated shocks. While there has been a smaller drawdown already, we are still far from extreme levels of volatility, valuation de-ratings or bearish risk appetite levels that indicate positive asymmetry (like they did in Q4 2018). In short, “without a more constructive view on forward macro fundamentals it could be quite risky to ‘buy the dip’ yet.“
Meanwhile, as this drawdown has been with relatively low vol so far, equity options are relatively cheap according to the bank, and for investors that are underinvested in equities, Goldman recommends buying call options and calendar call spreads, which appear attractive.
via ZeroHedge News http://bit.ly/2EZ2nOR Tyler Durden