Authored by Lance Roberts via RealInvestmentAdvice.com,
Is The Sellable Rally Done?
In last weeks missive, I noted the oversold condition of the market and the likelihood of a bounce:
“This week we are going to look at the recent sell-off and the potential for a short-term ‘sellable’ rally to rebalance portfolio risks into.
The markets only need some mildly positive news at this point to spur a ‘short-covering’ rally. I would encourage you to use it to reduce risk, rebalance holdings, and raise cash until the ‘trade war smoke’ clears.”
The market did indeed rally last week. While the initial sell-off in the market was attributed to potential tariffs on Mexico, which were indefinitely suspended on Friday, the real reason was the dismal employment report of just 75,000 jobs.
“The economy added only 75,000 jobs in May, about 100,000 fewer than expected, a sign that the slowing that is showing up in other parts of the economy is now affecting the job market.” – CNBC
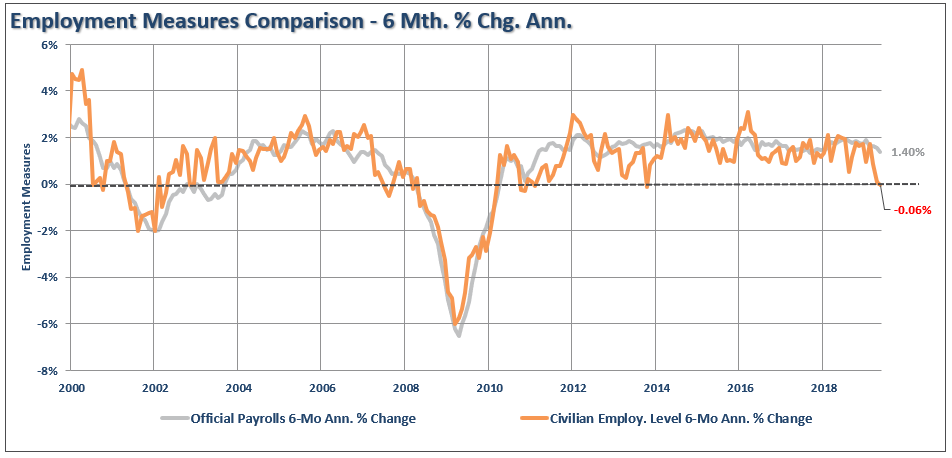
A couple of months ago, I warned of the potential for weaker employment as the “household” survey had already dropped sharply. It is likely, that without some major natural disasters which spurred a temporary bump in hiring in 2018, that official employment rates are going to play catchup.
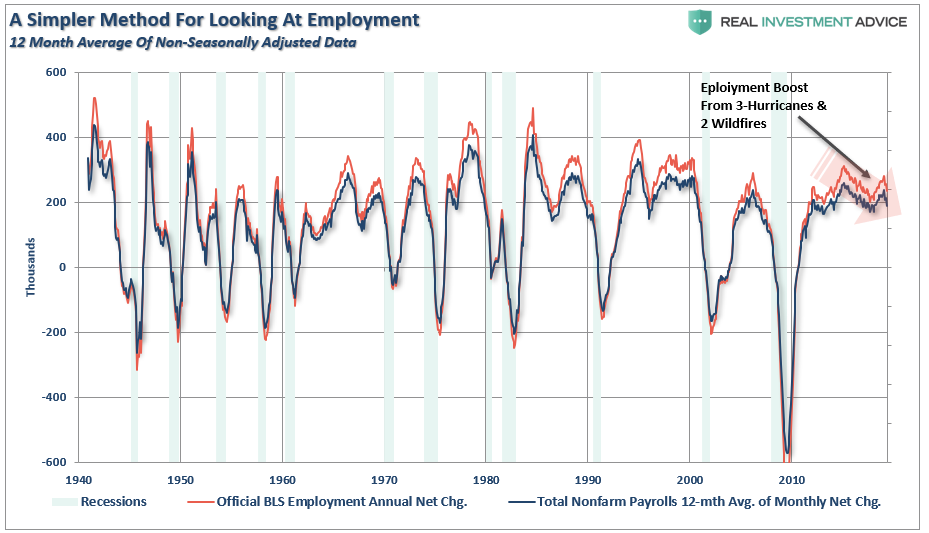
If we just use a simple 12-month moving average of the non-seasonally adjusted data, we get a better picture about what is actually happening in the economy. (NOTE: the official BLS measure consistently OVERSTATES employment during expansions and plays catchup during recessions.)
“So, why are the markets rallying?”
Two words – Rate. Cuts.
With employment weakening, along with a wide swath of economic data, stocks rallied sharply on Friday as the bond market priced in a certainty of a rate cut by the Federal Reserve.
“Stocks initially sold off on the report but then moved higher as the market took the news as a sign the Fed would cut interest rates. In the Treasury market, yields, already in steep decline this week, fell further. The 2-year yield closely reflects expectations for Fed policy, and it fell to 1.77% from an intraday high of 1.89%. The 10-year yield, which influences mortgages and other loans, fell to a low of 2.059%.” – CNBC
There is a very important misconception at play here.
What the report implies is that the “economy” is just a reflection of whatever the stock market does. However, that is inaccurate. Given that corporate profits are driven by the products they sell, and the price of stocks is based upon future expectations of the cash flows and earnings, ultimately the price of the market is slave to the direction of the economy.
Interest rates are the best predictor of the economic strength, and the yield curve has been screaming both “deflation” and “economic weakness” for months. (We have repeatedly warned on this issue – see here)
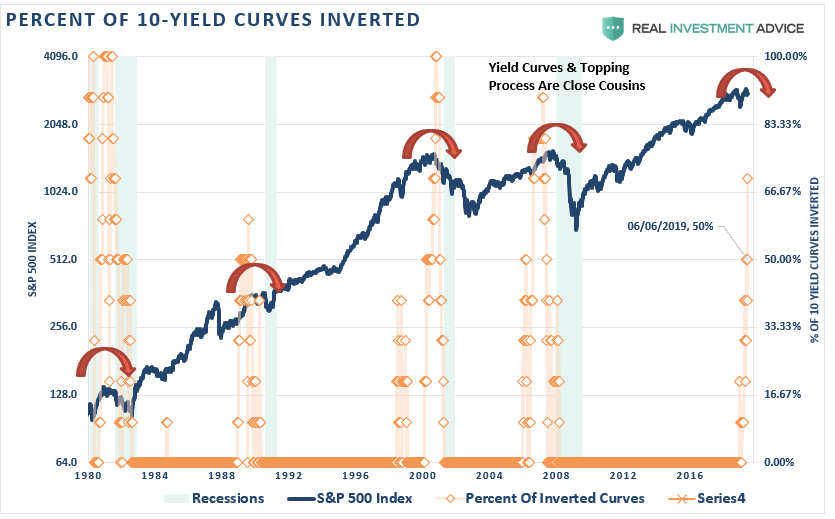
But more importantly, is the inversion of the Fed Funds rate to the 10-year Treasury.
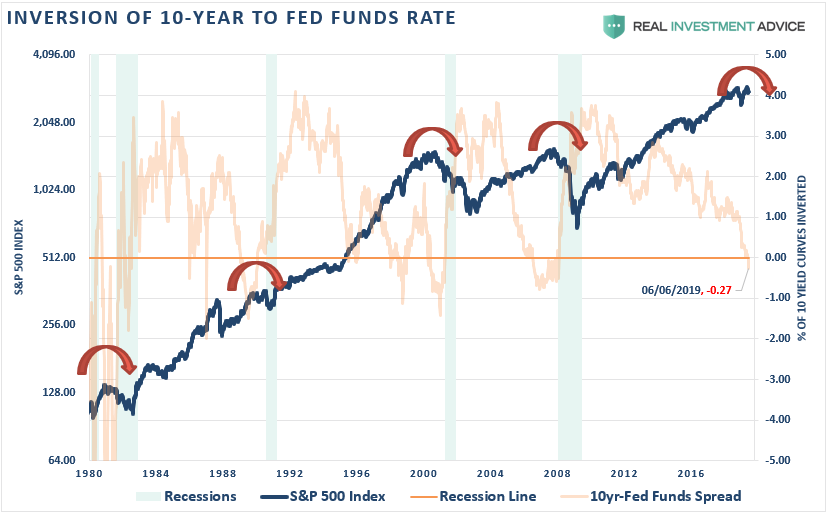
Here is the MOST important point of both charts above. Recessions don’t kick in until these inversions are reversed.
This is why David Rosenberg was absolutely correct last week when he stated:
“You don’t go long the first rate cut, you go long on the last one.”
This is because by the time the Fed quits cutting rates, the recession will be near its trough and the corresponding bear market in equities is almost complete.
As I stated, the rally this past week was expected. In fact, we alerted our RIA PRO subscribers (FREE 30-day trial) to a “trading opportunity” in the market on Monday. To wit:
- SPY has corrected the overbought condition and is testing the 200-dma.
- The “buy” signal in the lower panel was massively extended, as noted several weeks ago, which as we stated, suggested the reversal we have seen was coming.
- The correction last week has set up a tradeable opportunity into June.
- Short-Term Positioning: Bullish
- Add 1/2 position with a target of $290.
- Stop-loss remains at $275
The question to answer this week, is whether there is more left to this rally before the next decline?
More To Go
I think the answer to that question is “yes.”
I recently interviewed Charles Nenner who is a practitioner/forecaster of long-term stock market cycles. As he correctly predicted in our discussion, this current rally would start at the end of May and last into July before the next more serious decline begins. (Forecast begins around 1:30)
His comments align much with ours from last week:
“In the very short-term the markets are oversold on many different measures. This is an ideal setup for a reflexive rally back to overhead resistance.”
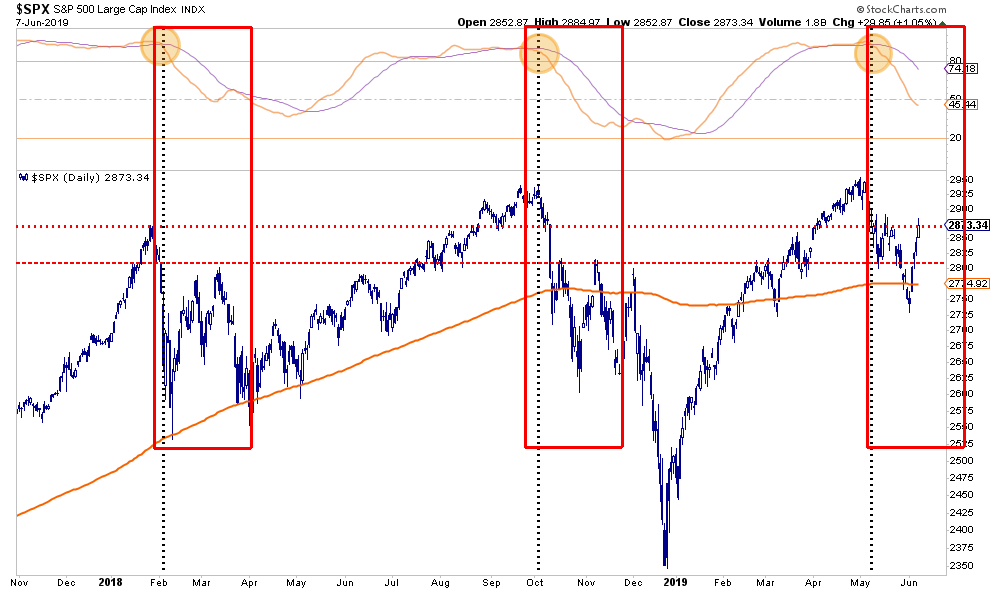
Chart updated through Friday’s close:
The have only reversed about half of the previously oversold condition which leaves some “fuel in the tank” for a continuation of the rally this coming week.
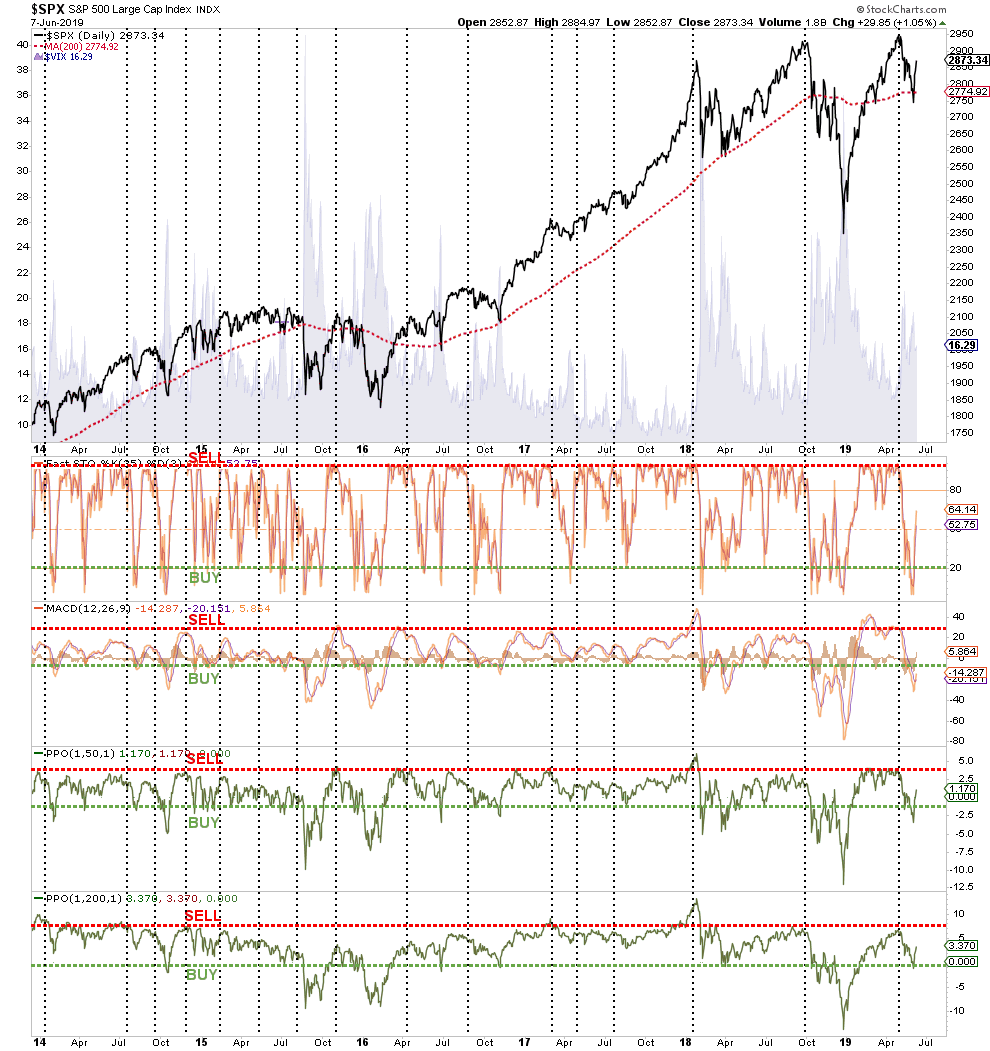
However, that doesn’t mean the “bull is back” and you should be complacent about your portfolio. The market remains on an important SELL signal as shown below. The last two times the S&P 500 has triggered a similar sell signal, there were sharp, aggressive, rallies which were fully reversed just a few weeks later. The current market action is extremely similar to those previous events.
The difference this time, is that many of the supports which drove the recoveries previously are either a) not present, or b) have already been priced in. As I said, while I think there is more to go in the short-term, it is highly likely the current rally will fail.
-
While it’s good that “potential” tariffs on Mexico were delayed, there were only a threat. Tariffs are still in play with China and there has been NO progress on a trade deal.
-
Earnings estimates are still far too high going into the end of 2019 and 2020. Read This
-
Economic data has turned markedly weaker both globally and domestically.
-
Expectations for a positive effect from more QE and rates cuts are likely misplaced. Read This.
-
At the end of September, Congress will face a debt ceiling and potential Government shutdown. The subsequent $4 Trillion continuing resolution will likely undermine confidence in economic sustainability as the deficit surges will past $1.5 Trillion.
-
There are no current supportive tailwinds (disaster recovery, tax cuts, etc.) to support economic growth.
We remain primarily long-biased in our portfolios, but are also slightly overweight in cash, and portfolio weight in fixed income. We are also carrying some hedge by having overweighted “defensive” stocks a couple of months ago which have continued to provide outperformance.
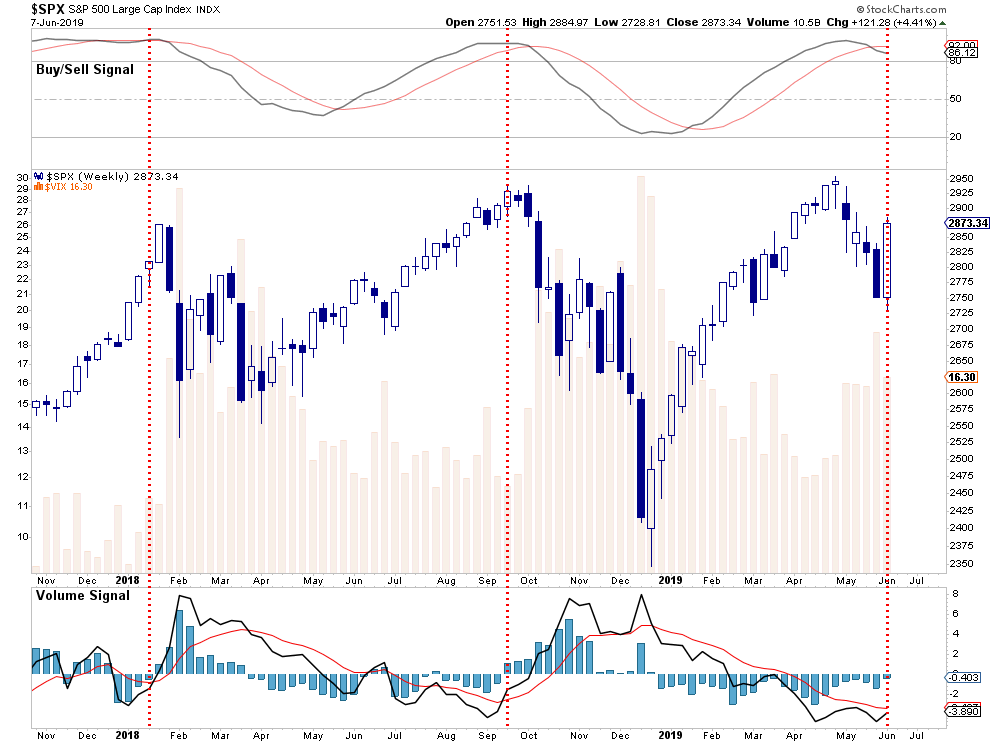
There is a very good possibility this rally will continue next week as momentum and short-covering levels have been breached. However, if the market fails to set a new high and turns lower, the risk of a downside break will grow as we progress into summer. The weekly chart below, is also suggestive the recent rally is likely unsustainable as with a “sell signal” in place, and our volume signal back at extremely low levels, suggesting a lack of commitment from traders, and volatility still at elevated levels and rising, have marked the last two tops.
Remain cautious for now. The market is still at the same level as it was 18-months ago, and it is quite likely it will be at these levels, or lower, by the end of the summer.
via ZeroHedge News http://bit.ly/2XyyXyx Tyler Durden