About a year ago, Jerome Powell was widely seen as the most hawkish Fed chair in years, perhaps decades, as a result of his determination to hike rates no matter what the macro environment looked like, eventually launching the great Q4 selloff with his comment that the fed funds rate is a “long way away from the neutral at this point”, even though today the Fed indicated that the neutral rate has “dropped” all the way to 2.5% or right next door. Whether due to that experience which resulted in the first bear market (1) (footnote one because the S&P dipped below 20% from its ATH for a few minutes on Dec 24 before closing just outside bear market territory), Powell has since folded like a cheap lawn chair and ever since January, has successfully “surprised” the market dovishly at every possible turn.
So now that Trump has successfully scared the Fed into submission to either the bond market, which is pricing in just under 4 cuts for the next year), the only “other” question that matters, and which will determine the outcome of the final S&P print this year, is whether or not the US and China successfully resolve their trade differences with either a grand deal or at least a ceasefire at the G-20 meeting in Osaka neek.
Here, there are some good and some bad news.
First, the bad news. Unlike dovish Powell, the outcome here looks far less promising for the bulls. Despite a last minute agreement to meet at the G-20, the probability of a “best case” surprise from the Trump-Xi meeting is virtually non-existent.
What about the good news? Well, thanks to Goldman, there is now a way to track the probability of a deal in real time.
As Goldman’s Chinese research team writes, “understanding how trade risks are discounted in equity valuation is crucial for investors to navigate short-term market volatility and assess tactical risk/reward” (obviously), and as a result Goldman has developed a “trade tension barometer” to measure the intensity of market-implied trade concerns.
What the trade deal indicator shows, is that the perceived trade concerns are now moderately below the stressed points in late 2018/early 2019, but that more importantly, the market appears to be pricing in a ~20% chance that a trade resolution could be struck by the two sides, sharply lower from ~80% in mid-April.
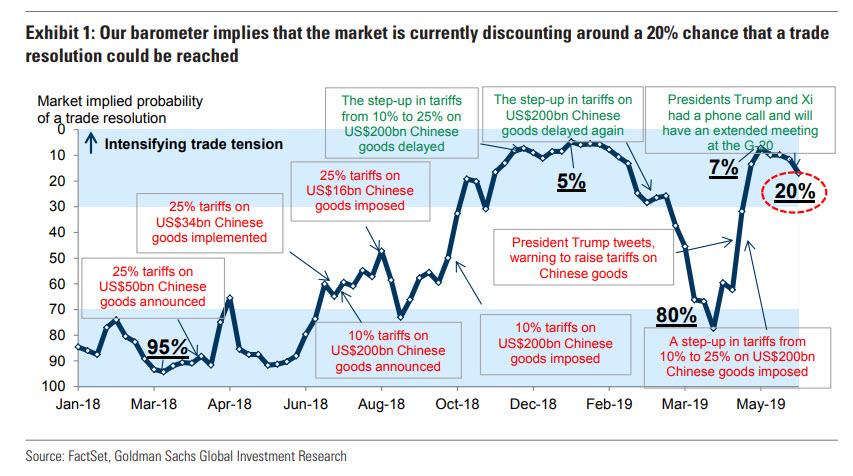
A few extra points on this trade barometer. First, for those who wish to recreate it at home, Goldman lists the key “trade concern” proxies that feed as signals.
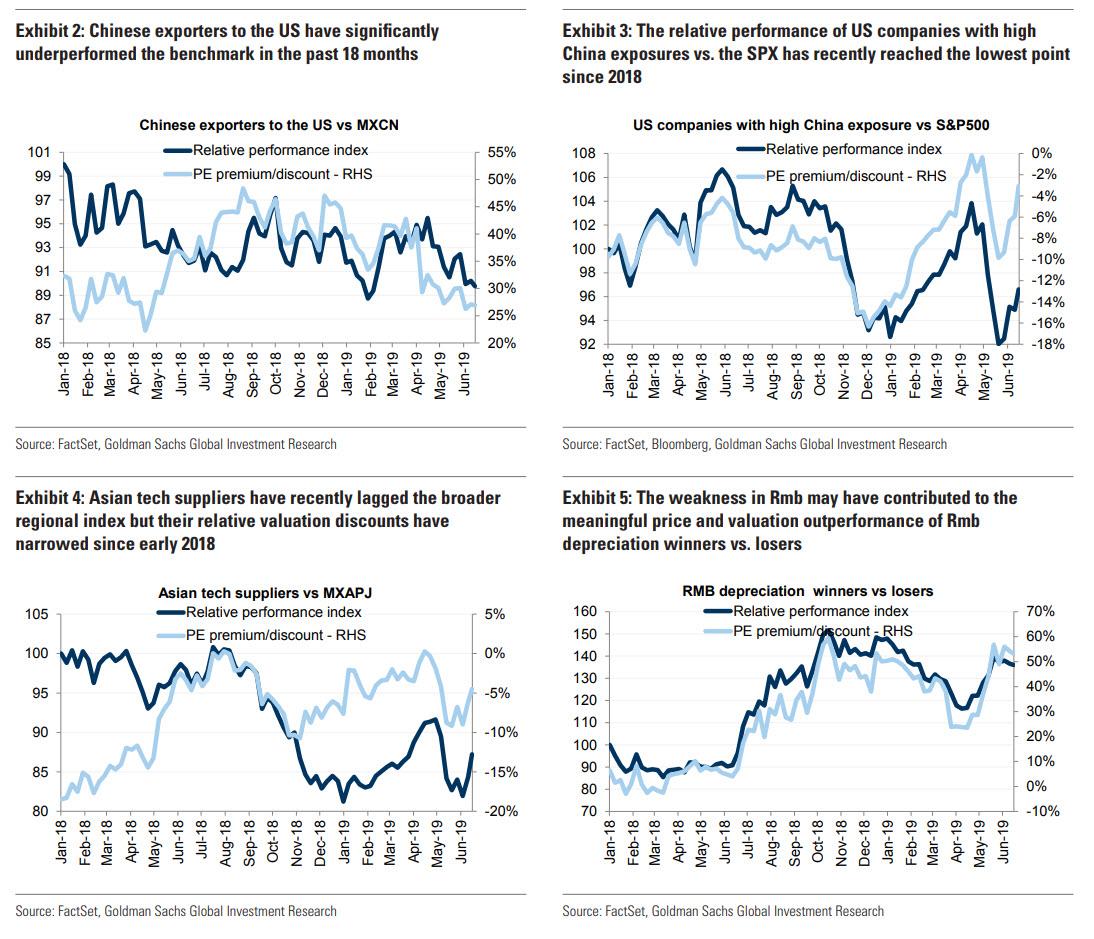
- Chinese exporters to the US: While the US accounts for only 1% of total revenues for MSCI China index constituents, the US market is a significant export destination for select Chinese companies, predominately concentrated in Tech Hardware, Consumer Discretionary and Industrials. As such, Goldman focuses on their relative price returns and valuation gaps versus the benchmark to better understand how the trade tensions have been discounted in the equity market.
- US companies with high China revenue exposures: Similarly, US equities are largely domestic-oriented from a revenue contribution standpoint but China is an important source of end-demand for a number of US consumer and tech companies, with China representing 17% of the top-line for the top-40 US firms in the S&P500 with the highest Greater China exposures. The bank focuses on these companies’ relative returns and P/E disparity relative to S&P500 to isolate the “trade factor” in their pricing regime.
- Asian suppliers to the US/China: The impacts and concerns of trade frictions have so far been most visible (and aggressively priced) in direct exporters in the US and China, but Asian companies along the tech and consumer goods supply chains outside of the two markets will likely see disruptions given how intertwined the global supply chain has become over time. As such, the bank adds the relative returns and valuation series for a list of Asian tech and consumer companies (ex. China) with high US sales linkages and significant production exposures from China to the sample universe.
- Rmb depreciation winners vs losers: While many macro and policy factors could move the Rmb, its seems that “trade” has been one of the most influential components in the Rmb pricing equation over the past 18 months. Therefore, the bank refers to its Rmb depreciation winners and losers baskets (performance and PE gaps) to gauge the potential FX/trade impacts on equities.
The recent moves in these various signals are shown below.
So what are the implications from the trade barometer… and the fact that odds of a trade deal are one in five?
- According to the latest barometer reading, Chinese stocks are pricing in a scenario where the perceived trade tensions are just moderately below the stressed points in late 2018/early 2019, with the intensity spiking since late April after a period of moderation from late January to mid-April. The latest inflection point also coincides with the unexpected u-turn of the Sino-US trade negotiation in early May when the US administration threatened to impose 25% tariffs on US$300bn of Chinese exports and the subsequent imposition of administrative restrictions targeting Chinese tech companies.
- Given the assumption that the observed datapoints are normally distributed, barometer readings can be seen as the market-implied probability for a “trade deal” if one believes the historical highs (Jan 19) or lows (Mar 18) over the past 18 months are in fact reasonable representations of those outcomes. Using this logic, the market is currently discounting around a 20% chance that a trade resolution could be reached by the two sides, versus close to 80% in late April. Once again, the barometer only focuses on the market-implied probability/expectation of a trade resolution, and the nature/feature of a “deal” is out of the scope of this analysis.
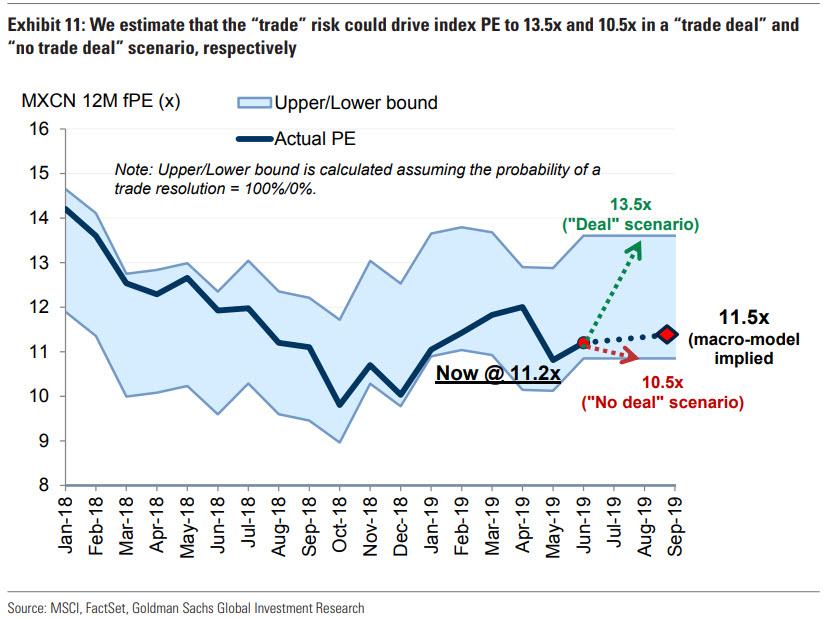
- As the barometer appears fairly correlated with the aggregate index P/E, one can also deduce the expected market P/E under a “trade deal”/”no trade deal” scenario based on simple regression analysis. In a nutshell, the model shows thatMXCN should trade at around 11.5x forward P/E under Goldman’s China base-case growth (6.4% GDP), FX (USDCNY @ 6.95), and US monetary policy assumptions (US FCI ex Equity @100.2), but “trade”, as a standalone factor, could drive index PE to 13.5x and 10.5x in a “trade deal” and “no trade deal” situation, respectively. This is largely consistent with the suggested results from the barometer that the market is factoring in a fairly slim chance for a “trade deal” to materialize at the moment.
- Overall, this exercise lends support to Goldman’s China Overweight call, which is predicated on China’s domestic policy flexibility (to counteract external challenges), stabilizing earnings momentum, inexpensive valuations with the trade concerns looking fairly priced (vs. our economists’ base case), and compelling investor positioning upside optionality in light of decade-low allocations in H shares and continued portfolio inflows to A shares due to index inclusions. That said, under a prolonged “no deal” scenario where we would expect the unfavorable trade impacts to percolate to other parts of the economy, we see potentially a 13% cut to corporate earnings growth by 2020 and as much as 20 % price return downside from here, with PEs comparable to their troughs in Oct 2018.
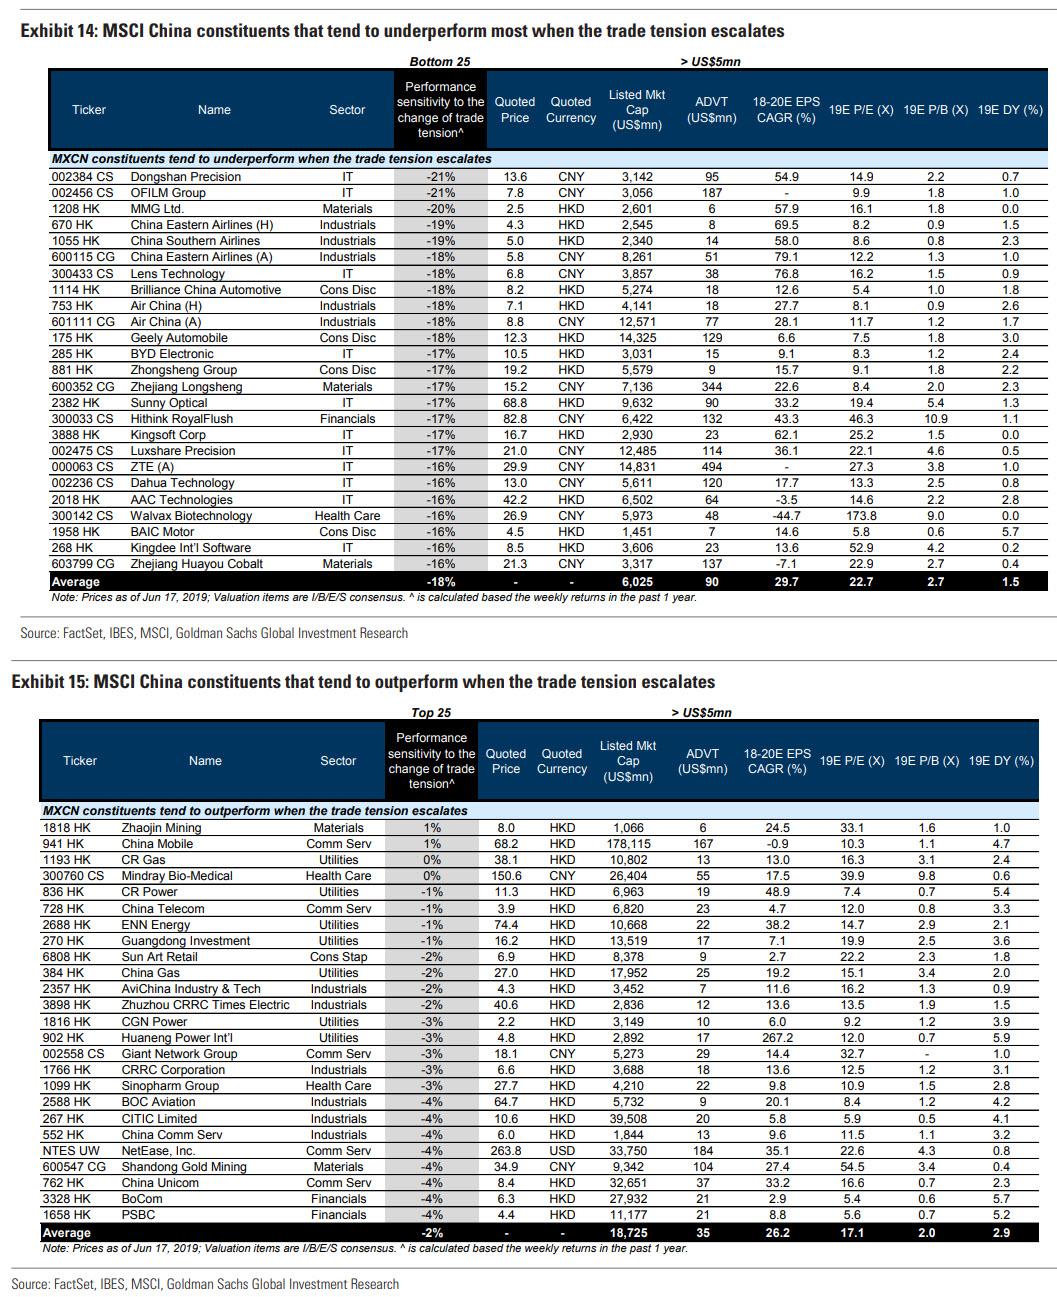
The bottom line: while the market seems to have discounted a fairly bearish trade negotiation outlook in equity prices, individual investors may have different views towards the trade development. As such, for the purpose of trading the “trade risk” for investors who embrace strong and active views on this particular subject, Goldman screens for Chinese stocks (and MSCI China index constituents) that have exhibited strong positive (i.e. trade tension losers) and negative (i.e. trade tension winners) relationships with the bank’s trade barometer in Exhibits 14 and 15 – their relative returns have tracked the barometer and the tariffs imposition time series well.
via ZeroHedge News http://bit.ly/2J0Rduq Tyler Durden