Amid record high asset prices in virtually everything following last week’s dovish FOMC, a fresh concern has emerged: the gaping “alligator jaws” between bond yields and stocks have never been wider, with the latest thrust coming first after Powell’s early June admission that an easing cycle is imminent, following by last week’s even more dovish FOMC announcement, which confirmed that a July rate cut is in the books, and sent stocks to new all time highs, while bond yields tumbled below 2%, the lowest in three years.
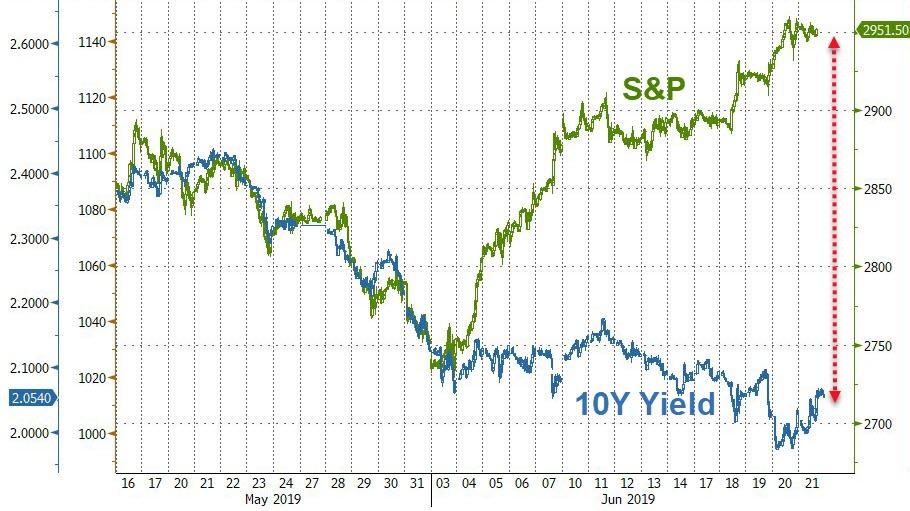
The problem boils down to one simple observation: on one hand stocks are telegraphing substantial market upside and, at least in theory, a booming economy, while bond yields – at 3 year lows – are screaming recession.
Some Wall Street strategists, such as Deutsche Bank’s Aleksandar Kocic took on a traditionally whimsical approach to the problem and explained it in the context of Schrödinger paradox… or in his case plates:
In the same way as Schrödinger plates, the economy at the moment is in a superposition of two states – it is both booming and it is headed for a recession. The two states of the economy are entangled. However, we cannot know which state we are in without interfering with it.
And visually:

The extended metaphor – which we discussed extensively yesterday – culminated with the following dilemma:
If the Fed does not cut rates (we open the door), the recession is likely.
If the Fed cuts rates, however (we do not open the door), the recession is averted, but we wouldn’t know if the cuts were needed.
His conclusion: “in either case, Fed actions interfere with the state of the economy and affect the outcome, and in both cases we face the consequences.” What is more troubling is that we have reached a point where the consequences of the Fed’s actions are dire in either case, resulting in either recession or loss of Fed credibility and independence:
In the case of unresponsive Fed it is a recession, while in the case of an accommodative Fed it is the loss of central bank independence and potentially another round of trade wars and even more pressure on the Fed to cut rates with further markets addiction to stimulus and possibly higher inflation etc.
In not so many words, that is the ultimate Catch 22 that the Fed has created: the market and economy are only viable as long as the Fed is backstopping them; once the support goes away, the wave function – to extend the flawed analogy – of the economy and market collapses, and the true state of both is exposed (at the cost of trillion in risk asset losses).
Others have observed the ongoing divergence between risk assets and yields at a more simplistic level, and as Bloomberg observes, the moves have extended the “dueling bull market” theme in which Treasury traders fret about dimming growth while everyone else celebrates an accommodative Fed. Each camp expects it to end badly for the other.
“A race of this pace in both stocks and fixed income is unsustainable,” said Marshall Front, the chief investment officer at Front Barnett Associates. “People who were long bonds are going to have a problem. We’re not going to have a recession or a dip in economic activity that’s going to take us off course, and rates are going to go back up.”
Others are similarly perplexed:
“There’s been a lot of press suggesting that the bond and stock markets are conveying different messages to investors,” said Mark Heppenstall, chief investment officer of Penn Mutual Asset Management. “But to me where we stand in interest rates today, where we stand in persistent low inflation today means that whatever investors are willing to pay for earnings should be higher based on the fact that interest rates are lower.”
To be sure, the recent movement in asset classes has been a gift to those portfolios which are long both sets of assets, modeled on the classic 60/40 stock-bond allocation, and which in Q1 of 2019 enjoyed the best period for the strategy in nearly a decade, and now it looks as though those gains are set to grow come the end of the second.
Meanwhile, as Bloomberg notes, “for the naturally skeptical, it’s hard to watch everything go up at once without conjuring visions of bubbles doomed to pop.” Of course, everything is only going up because the Fed is doing, or at least saying (for now) whatever the market wants to hear, in the process making this decoupling even greater.
* * *
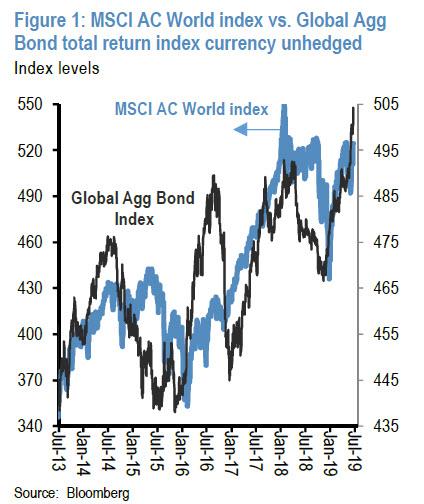
There is another key observation: maybe the surge in both bonds and stocks is not an ill omen, but perfectly self-explanatory. This is the argument made in a Friday note from JPM’s Nikolaos Panagirtzoglou, in which the derivatives strategist writes that while this year’s co-movement of bonds and equities seems rather unusual, “it is actually more common than typically thought. In fact a co-movement between equities and bonds has been in place as a broad trend for most of the past few years. This is shown in Figure 1 which depicts the MSCI AC World index along with the Bloomberg Global Agg total return index currency unhedged. The two indices have been trending up sometimes in tandem over the past six years. More importantly, any significant deviations between the two were not sustained for more than a few months.”
But what explains this “unnatural” co-movement, which – all else equal – telegraph a future beset with both inflation and deflation? In JPM’s opinion the prevalence of fixed-weight allocation frameworks among investors, such as 60:40 risk-parity and balanced funds, retail investors, pension funds and SWFs (e.g. the Norges Bank), “are responsible to a significant extent for this co-movement between equities and bonds.”
Here are the mechanics, as explained by Panigirtzoglou: When the bond market expands because of a strong bond rally like this year, these fixed weight allocation investors find themselves overweight bonds and underweight equities and thus need to buy equities to rebalance their portfolios in line with their rebalancing thresholds. Via this rebalancing these fixed weight investors push equity prices up and thus a bond rally ends up inducing an equity rally. And the intensification of this year’s bond rally in May and June has put even more pressure on such investors to rebalance away from bonds or deploy available funds into equities.”
This, to an extent, is a paraphrase of the “Fed model” which suggests that the lower rates drop, the higher equities rise as investors are forced into riskier assets to make up for the lack of yield in risk-free securities.
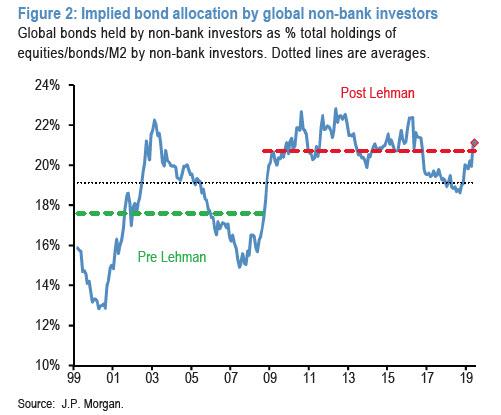
One way to quantify the divergence practically is to look at the allocation to bonds and stocks across the world’s investors. To do this, JPMorgan excludes banks – entities that typically invest in bonds rather than equities – and focuses on the universe of non-bank entities, finding the the amount of bonds held by this group of investors is around $32trillion and unchanged from the end of 2016. This compares to $54tr of cash and $67tr of equities based on DataStream’s global equity index universe. More importantly, on a percentage basis, non-bank investors, which invest in both bonds and equities globally, have an allocation to bonds of 21.1% currently (Figure 2). This 21.1% bond allocation
is just above the post Lehman historical average and well above the 19% low seen in September last year.
This is an important difference to last year. This year’s bond rally which gathered pace in recent weeks has unwound entirely the large bond underweight that had emerged in September last year.
Meanwhile, over on the equity side, the mirror image of this unwinding of the previous bond underweight is that the current equity overweight is significantly smaller from that seen in September last year, which at 45.5% represented a post Lehman high at the time.
So, according to JPMorgan, despite global equity prices being close to the highs of last September, investors are not as OW in equities as they were last September simply because bond markets rallied strongly this year making them less UW in bonds, or to put it another way:
“this year’s bond rally has been boosting equities by creating more room for investors to increase their equity allocations. This is shown in Figure 3 which shows that investors globally have an allocation to equities of 43.6% currently, which is somewhere in between the post Lehman high of 45.5% seen last September and the recent low of 41.8% seen last December. This 43.6% represents an OW equity allocation as it is above both the 40% post Lehman average and the 43% longer-term historical average.”
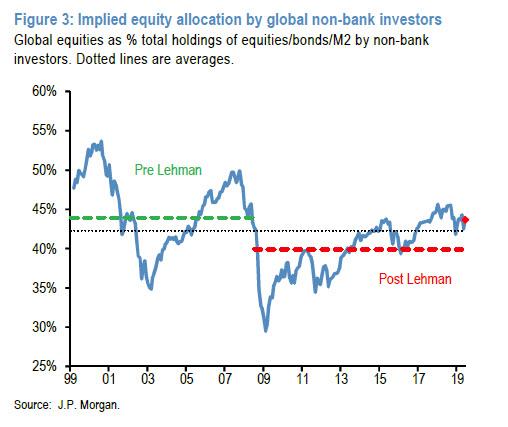
But to all those who say that it is only a matter of time before stocks see the prior, post-Lehman highs, JPM says “not so fast”, because while allocations could theoretically approach their previous cyclical extremes, there are two reasons why previous levels are less likely to be achieved.
- The first is that already over the previous two cycles, the cyclical peak in equity allocations had already been declining, and the cyclical trough in bond allocations rising, likely reflecting structural and demographic changes over time. Given the structural changes in markets and economies in the post-Lehman environment, this suggests that post-Lehman period comparisons are more relevant.
- The second is that G4 central banks may have to shift to even more aggressive QE programs going forward than those seen over the past decade, in order to induce the non-bank private sector to shed even more bonds from here.
So with that in mind, and by looking at Figure 3, one simple way of thinking about the upside for equities from here according to Panigirtzoglou is “to calculate the rise in equity prices needed for investors to become as OW in equities as they were last September.” According to JPM’s calculations global equities would need to rise by 7.8% from here ceteris paribus to make investors as OW in equities as last September. In other words, assuming no further upside for bonds from here, any upside for equities should be limited to high single digits.
There are some more reasons why this this potential single-digit equity upside is facing several challenges.
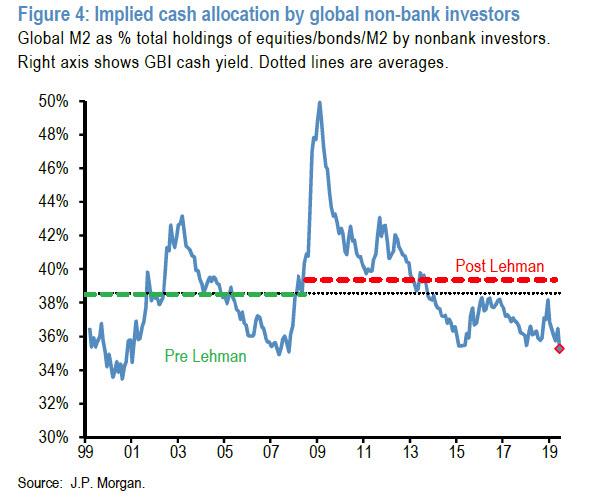
- The first one is the extreme cash UW that has emerged this year as a result of the simultaneously strong rally in bonds and equities. Indeed, this is shown in the next chart below, which shows an implied cash allocation by investors globally of 34.3%, the lowest in the post Lehman period and the lowest since 2007.
- The second challenge is the extremity of this year’s bond rally. It is true that, given the prospect of central banks cutting rates from here, the extremity of this year’s cash underweight and the extremity of this year’s bond rally are perhaps justified.
But what if rate markets got ahead of themselves? What if the gloom scenario postulated by Kocic does not materialize, and “central banks fail to validate market expectations over the coming months?” – this would be the scenario which the Deutsche Bank strategist yesterday wrote would lead to a recession (as the wave function of the “plates” collapses… and so do they).
In a nutshell, to the top JPMorgan strategist, “this is a major risk for equity markets going forward: if central banks fail to validate over the coming months market expectations of universal rate cuts, equities could be hit not only by a potential selloff in bonds that would mechanically make investors more OW in equities, but also by a potential increase in cash allocations as investors cover their currently extreme cash UW.”
To JPMorgan, this potential for market disappointment emerging from the Fed as framed by this discussion (and yesterday, by Deutsche Bank), shows the challenge equity markets are facing going forward.
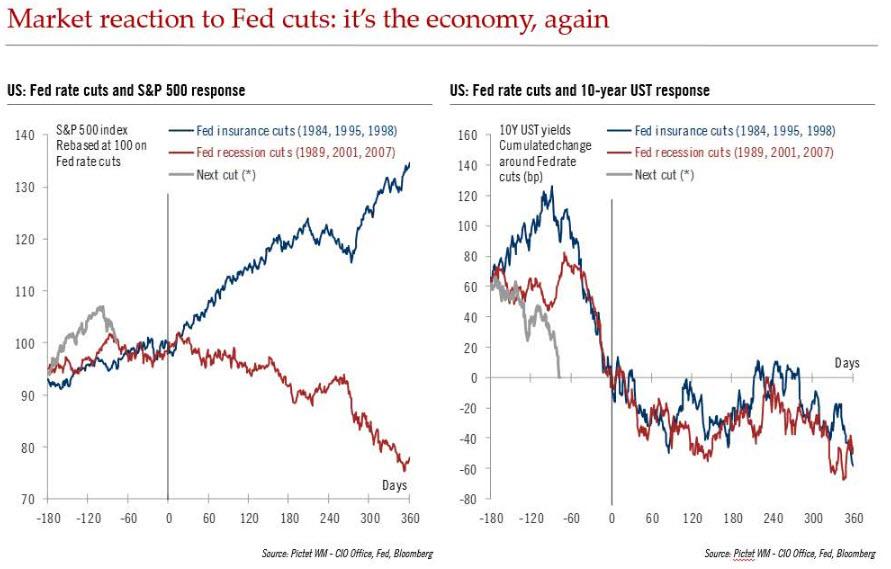
Said otherwise, as hinted by James Bullard’s letter explaining why he objected to the Fed’s latest decision to keep rates unchanged, the prevailing thesis is that equity markets appear to be pricing in at the moment is of a pre-emptive Fed that is set to provide insurance similar to the 1995 and 1998 episodes.
But is it?
In a scenario where the Fed and/or other central banks fail to cut by as much as markets expect, perhaps because growth turns out to be better than expected, the upside for equities from better growth news could be offset by a bond selloff via the mechanism described above.
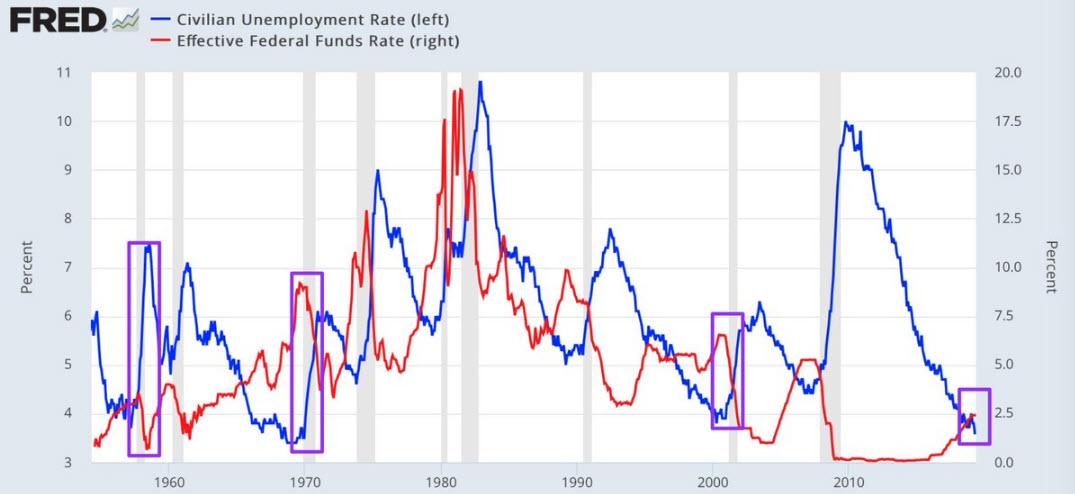
Finally, in the third and most painful for the bulls, scenario where the Fed and/or other central banks end up being rather reactive and cut rates in response to weak growth, equities could follow a weak trajectory similar to more typical previous Fed easing cycles, rather than the strong trajectory seen during 1995 or 1998. For those who need a reminder, it is also the case that the last three recessions all followed within a few months after the Fed’s first rate cut. Furthermore as @Northmantrader recently pointed out, every time the FED cut their rates while unemployment was below 4%, a recession started almost immediately?
In other words, of the above three scenarios only one scenario, that of a pre-emptive Fed that is set to provide insurance similar to the 1995 and 1998 episodes, is positive for equities.
And here a problem emerges, because as Bullard explained last week, preemptive means cutting rates when growth indicators are still good rather than waiting for growth indicators to weaken.
And this brings up what JPMorgan believes is the most important question following this week’s FOMC meeting:
“If the Fed is truly committed to preemptive rate cuts in order to provide insurance why did it not cut its policy rate this week?”
* * *
And while not necessarily connected to JPM’s line of reasoning, if perfectly summarizing the zeitgeist on the continued Fed manipulation and intervention in markets, here is a must-read quote from Steve Chiavarone, a portfolio manager with Federated Investors:
“Everyone, whether they admit it or not, believes that there needs to be some major comeuppance, some cleansing moment, because for whatever reason the good puritan instinct that lies in America feels as though you can only cleanse through some level of pain. There’s an obsession of when the next recession is going to come. What I think has been forgotten is that if you want lower for longer, you also have to accept the longer part of it. And that’s what we’re getting.”
We are indeed, but with the business cycle set to become the longest in history in just one week…
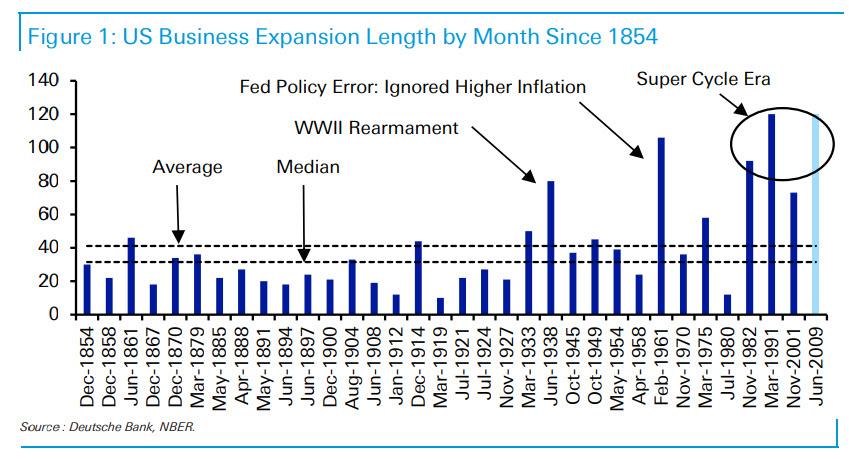
… the questions of just how much longer can the Fed keep indefinitely postponing the “longer” part will only grow louder, until finally not even the monetary Atlas that is Jay Powell, can keep the sky from falling any longer.
via ZeroHedge News http://bit.ly/2N9713n Tyler Durden