In lieu of his traditional morning commentary, and while preparing for the key meeting this week, Nomura’s derivatives guru decided to pass-along a few charts “which capture the current market zeitgeist” along with the conclusion that the overall “output still speaks to the investors positioned for the end-of-cycle “Slow-flation” narrative: Long Global DM Bonds / Rates, Under-positioned for Equities rally and now tilting “Short Dollar” via tactical Longs developing in Gold, Commods and even Bitcoin.”
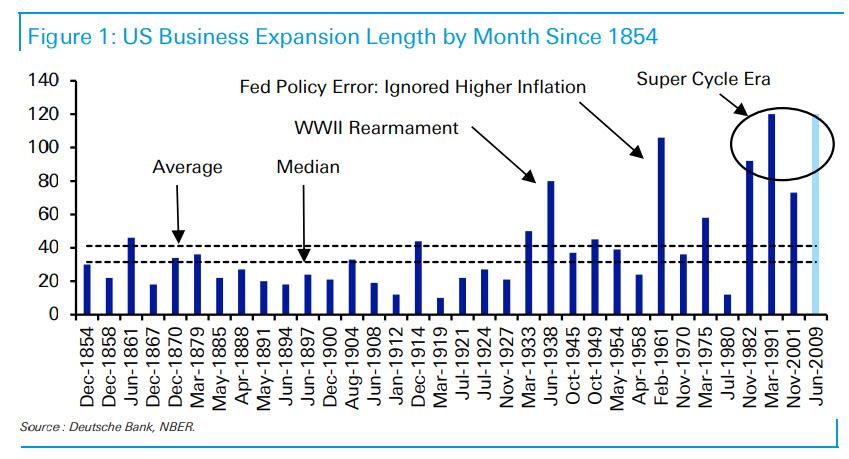
Of course, with the US economic expansion just 6 days away from being the longest on record (unless the NBER decides in the next few months that the recession started some time in Q2), it is not difficult to see why end-cycle trades dominate – both on Wall Street and the Fed, which is doing everything in its power to extend the weakest recovery on record my at least a few months, even if it is kicking and screaming.
So, without furhter ado, here are – as McElligott calls them – the goods:
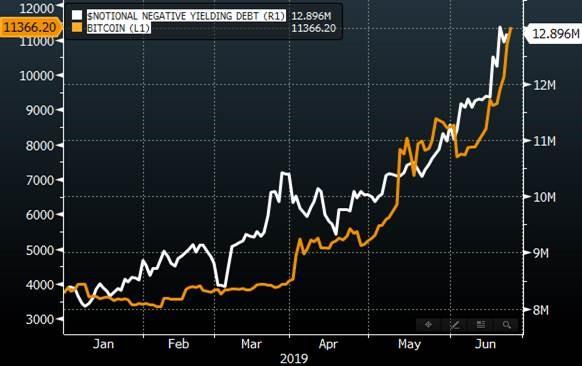
1. Bitcoin: bitcoin is a play on escaping “negative yielding debt”, as global central banks tilt back to “easing” and currency devaluation in 2019.
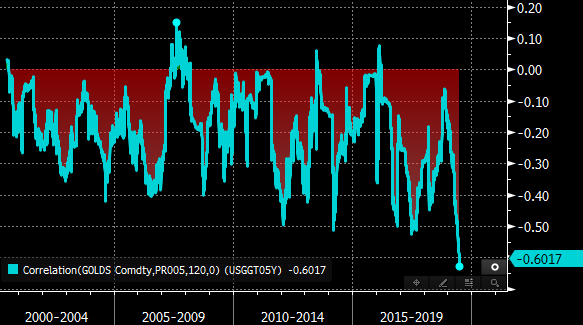
2. Gold: this best way to “short the USD” is the most inversely-correlated asset to US short-term real yields in the past 20 years.
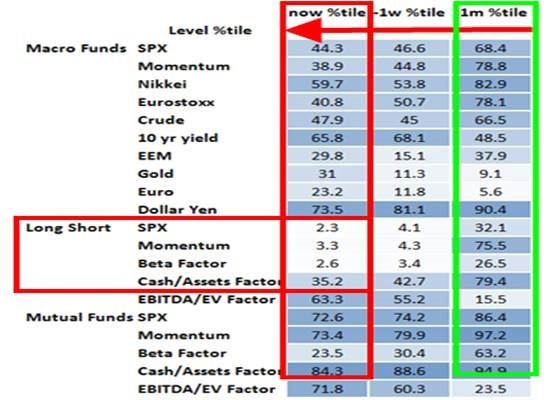
3. Fund Performance: Performance beta across assets/factors shows continued de-risking into the 1 Month move higher from macro, equities L/S and mutual funds (percentiles since 2003).
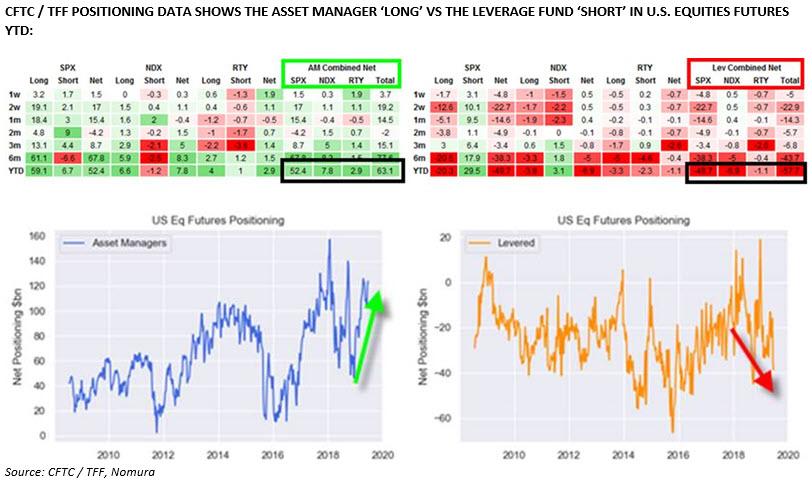
4. Positioning: The latest CFTC data shows asset manager “long” vs leverage fund “short” in US equity futures YTD:
5. Hedge fund faith in stocks (or lack thereof): The equity long/short hedge-fund universe “beta to the S&P” is testing multi-year lows, in the 2.3% percentile since 2003 as nobody believes this fake rally.
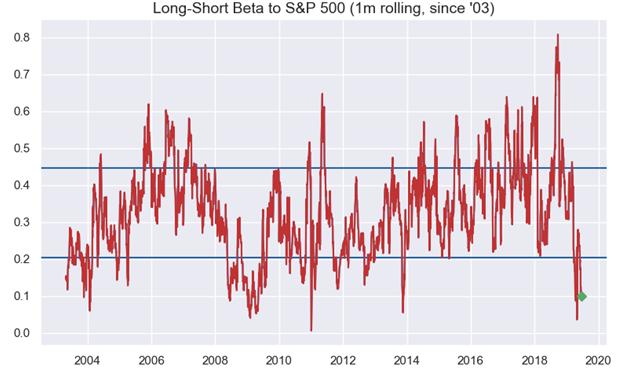
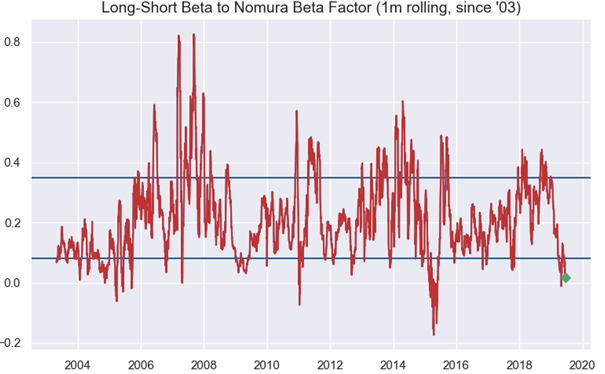
It’s just “beta to the market”, but also “beta to the beta factor” which is at 2015 lows, as a red on “long defensives/low vol”, and “short cyclicals/value.”
6. “Slowflation“: For those seeking the expression of “slowflation” in equities, look no further than “long defensives” and “secular growth” against underweight “cyclicals”, a relationship that has caused funds great pain in recent months.
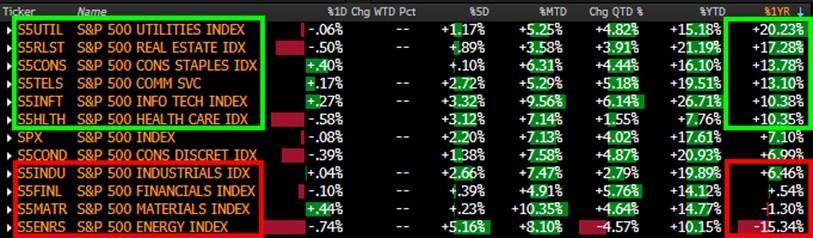
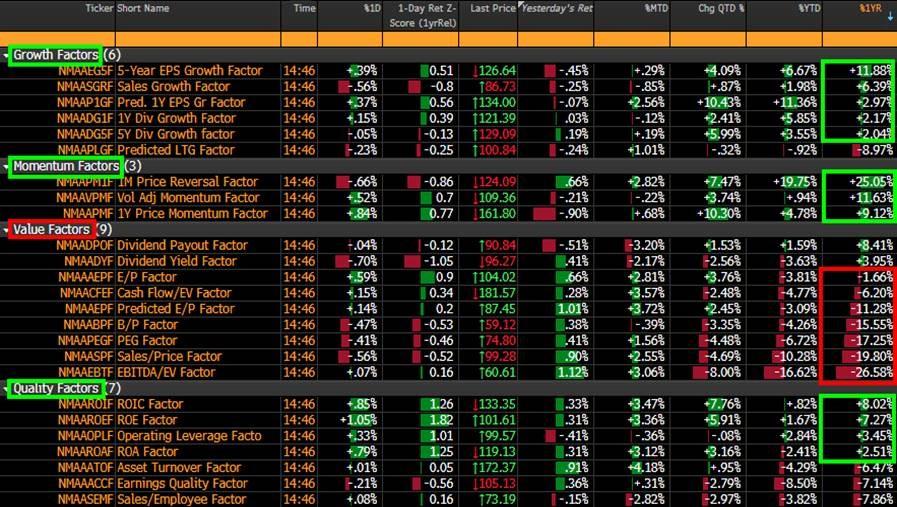
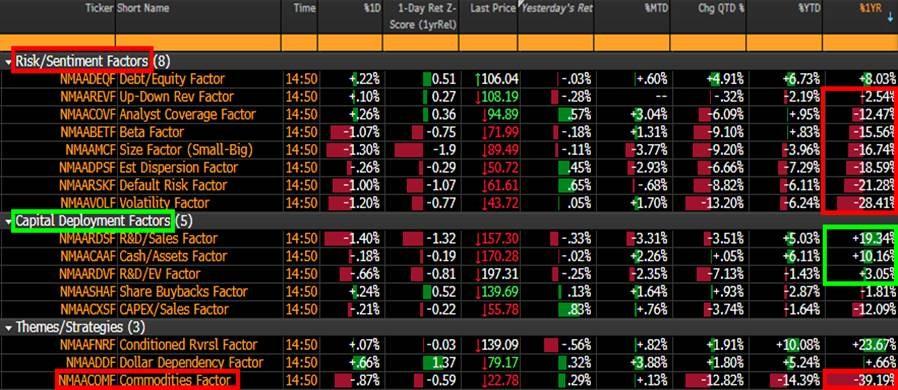
7. Factor exposure: US stocks factor behavior is indicative of the same as per 1Y performance of “growth”, “momentum” and “quality/high cash” versus “value” and various “high beta” risk factors:
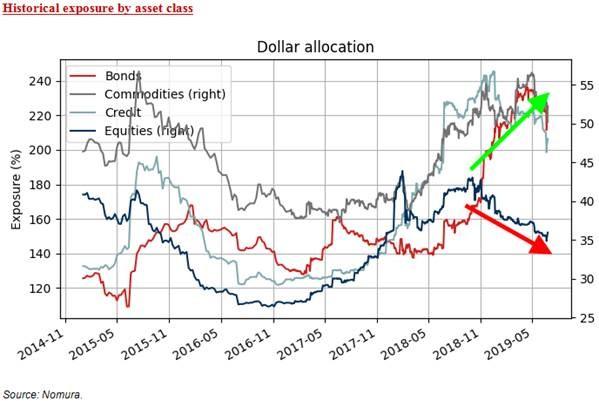
8. Risk-Impairity: Nomura quants’ risk-parity model allocation shows extent of govt bond allocation (leverage deployment) against the ongoing reduction in equities exposure as the outlier.
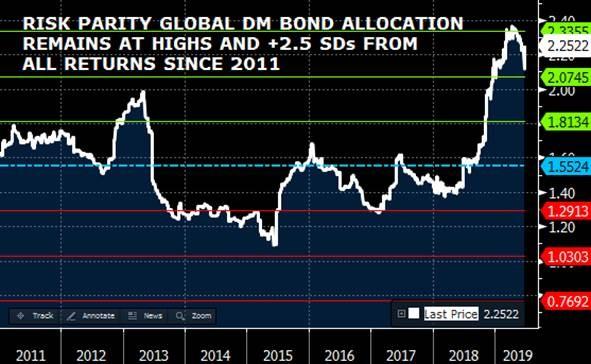
9. Duration im-parity: Nomura’s risk-parity model shows that gross-exposure to global DM bonds remains near new highs since 2011.
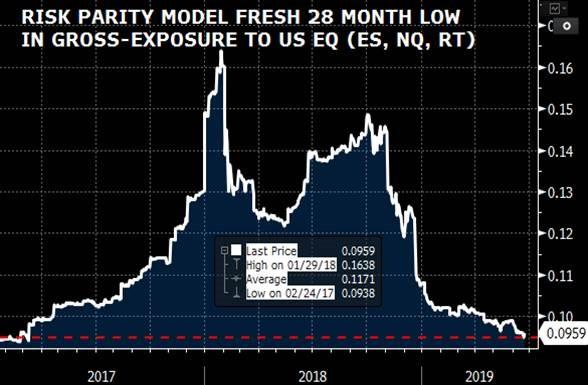
10. Risk Pars don’t like equity risk: While risk parity funds are all ine DM bonds, they seem loathe to go heavy into us stocks, as the following chart shows: risk-par exposure to US equities is at a 28 month low.
via ZeroHedge News http://bit.ly/2X4aUpS Tyler Durden