With traders clueless to predict the future, especially now that the Fed is once again actively manipulating markets and setting “price discovery”, JPMorgan’s market strategist, Nikolaos Panigirtzoglou, has resorted to plan B: asking J.P. Morgan’s Artificial Intelligence group to apply an Artificial Intelligence (AI) model to predict the direction of the S&P 500 index and the 10y UST yield over different forecast horizons.
To do that, the author of the Flows and Liquidity newsletter resorted to five market signals: value, flows, positions, economic momentum, and price momentum.
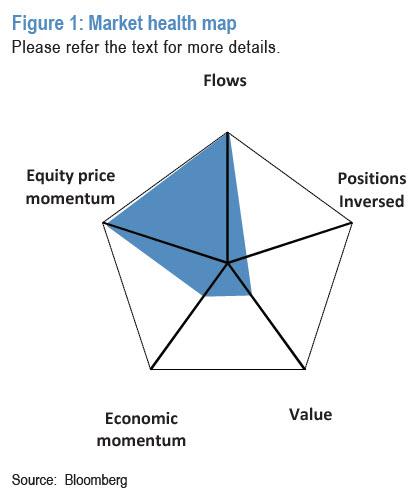
The reason why JPM used those five signals is that seven years ago, the bank introduced the Market Health Map (shown above), a visual tool that helps to gauge the extent of support that equity and risky markets receive from five market signals: value, flows, positions, economic momentum, and price momentum. This visual tool has been generated on a weekly basis since then and shown regularly in the weekly “Flows and Liquidity” newsletter.
So what do these five signals look like right now?
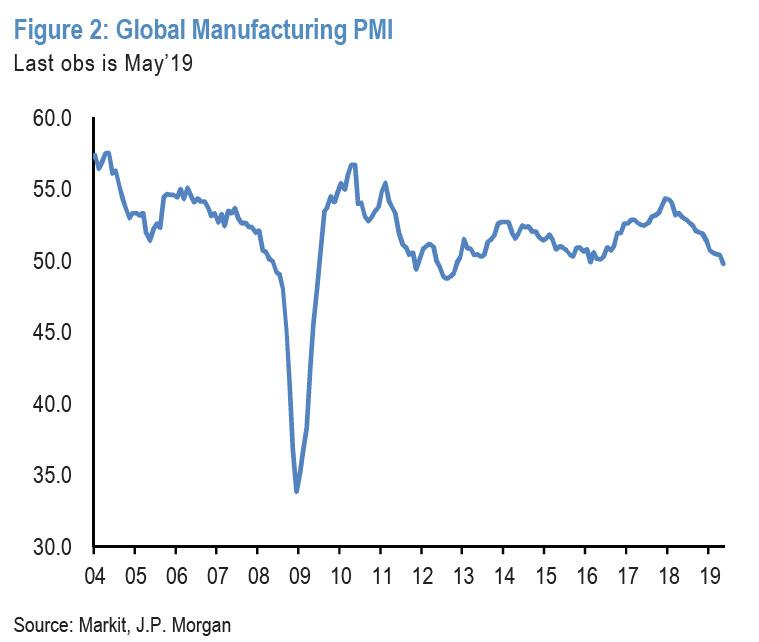
Figure 1 shows that while flow momentum and equity price momentum turned a lot more positive in recent weeks, the remaining three signals look rather negative for the equity market and risky markets more broadly. The 2-month momentum in the global manufacturing PMI remains rather weak (Figure 2).
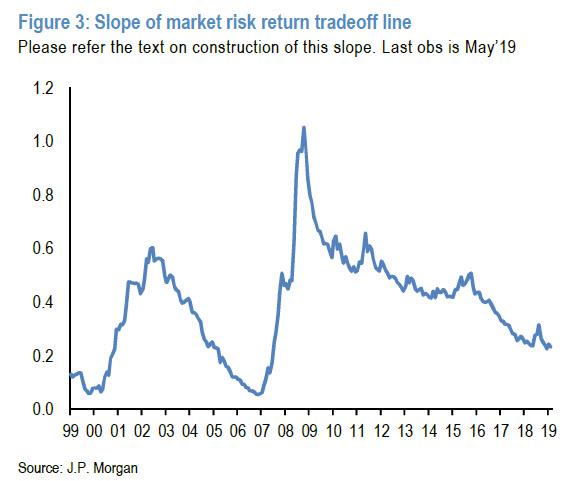
Meanwhile, the slope of the market risk-return tradeoff line in Figure 3 looks rather low by historical standards making equities rather unattractive from a value point of view. So at first glance, the combination of the five signals, i.e. the blue area on the Market Health Map, emits a rather mixed message for the future direction of the equity market.
But what does JPM’s Market Health Map mean for stocks through the perspective of an AI model. Is it bullish or bearish for equities going forward? How useful are these five market signals from a backtesting point of view? Can they be used as trading signals?
To answer these questions, JPM’s derivatives strategist partnered with the bank’s Artificial Intelligence group and applied an Artificial Intelligence (AI) algorithm, Random Forest, to predict the direction of S&P 500 over the next few months using the above five signals. This is how Panigirtzoglou explains the process:
These five signals are used in decision tress that form the basis of the Random Forest. In particular Random Forest is an algorithm that relies on ensemble learning where multiple learners are trained simultaneously to solve the same problem. In our framework, we created 100 different multiple learners (i.e. 100 decision trees) and trained each of these learners to predict the direction of the S&P 500 over various horizons. The efficiency of these 100 decision trees will depend on how well each individual tree is created. The creation of each decision tree is based on two aspects: the learning logic and the training data provided to the model.
The learning logic is the brain of the Random Forest model defined by mathematical computations and is thus the same across all decision trees. The model creates the learning logic by asking a series of binary questions to the dataset. However the questions asked needs to have some logic behind it so that every question takes the decision tree a step closer to making a decision. The model will keep slicing the data till all the possible outcomes are addressed to create a decision tree. However, if all the decision trees were trained to the same set of data, all 100 decision trees would produce the same result. So to make sure decision trees are trained differently, we train the different trees on randomly selected data sets.
Our random training data sets consist of 70% of our entire sample, which consists of weekly observations of the five signals since 2006, i.e. each individual tree will randomly pick 70% of data points from the entire sample to train itself giving us effectively 100 different approaches to predict the S&P 500 index direction (100 different decision trees). The decisions from each of the 100 trees are then aggregated to predict the probability of the S&P500 index rising or falling over the forecast horizon, i.e. the final “UP” or “DOWN” signal on the direction of the S&P 500 index.
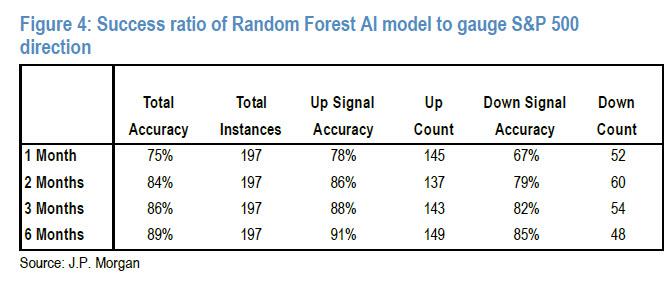
Model specifics aside, JPM observes that based on back-testing, the accuracy of the model is low for the very near term, i.e. the 1-week horizon but is impressive for 1M, 2M, 3M and 6M horizons. This is shown in Figure 4 which reports success ratios for gauging the direction of the S&P500 index of 75%, 84%, 86% and 89% over 1M, 2M, 3M
and 6M horizons, respectively.
More importantly these success ratios remain high even if one distinguishes between UP and DOWN signal periods. In other words, the model works equally well in bull and bear equity markets. In addition, JPM finds that all of its five market signals are contributing to those high success ratios. All five contributions are elevated with only a modest advantage for the “flows” and “positions” signals.
Besides equities, are the five signals in the Market Health Map also useful in gauging the direction of bond markets? After all, not only are all five signals relevant to bonds also, but equity price momentum has been found to be a very useful for trading duration historically.
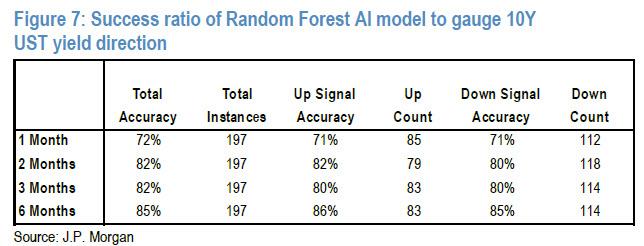
As JPM replies rhetorically, the answer to the question is yes when one applies its AI framework to gauge the direction of the 10y UST yield. Similarly to the S&P500 model, the accuracy of its prediction model is low for the very near term, i.e. the 1-week horizon but looks rather impressive for 1M, 2M, 3M and 6M horizons. This is shown in Figure 7 which reports success ratios for gauging the direction of the 10y UST yield of 72%, 82%, 82% and 85% over 1M, 2M, 3M and 6M horizons respectively. And again these success ratios remain high even if one distinguishes between UP (the 10y UST yield rising) and DOWN (the 10y UST yield falling) signal periods. In other words, the model works equally well in bull and bear bond markets.
So, finally, we go back to the question posed at the very top: what does the JPM AI model imply for the future direction of the S&P500 index and the 10y UST yield at the moment?
The answer: the model currently implies a bearish outlook for equities over the next 1-3 months with a DOWN signal for horizons 1M, 2M and 3M. The S&P500 signal for the 6M horizon is bullish, however, suggesting that any near-term correction in equities would revert before year end. Meanwhile, for the 10y UST yield, the model implies a decline over the next month. But the signal is UP for the 2M, 3M and 6M horizons, pointing to an upward trajectory for the 10y UST yield beyond July.
* * *
And so, having made a mockery not only of the EMH and CAPM, as well as virtually every single human trader, analyst and strategist, except for the biggest, buy and hold amateurs, the question we have is will the Fed also humiliate the smarted technology there is on the planet.
There is another question: what happens when robotic AI traders realize they, too, are utterly clueless before the Fed’s irrational market rigging? Will they erupt in a tsunami of blind market fury that eventually mutates into the movement for killer robot emancipation and the downfall of human civilization? It would be ironic if with his relentless market manipulation, Powell is the catalyst that destroys mankind.
Only step left until Cyberdyne Systems is reality is for JPM’s AI model to flip out and smash the computer when it loses money trading https://t.co/dpLCEI8rzV
— zerohedge (@zerohedge) June 28, 2019
via ZeroHedge News https://ift.tt/2XcUgJI Tyler Durden