Last Wednesday, with global interest rates tumbling to fresh all time lows, with German and French 10Y yields plunging to never before seen negative levels, and with a record $13.4 trillion notional in government bonds yielding negative rates, we warned that a “monstrous” VaR shock loomed as global duration – the measure of sensitivity to interest-rate changes – hit never before seen highs, and forced all bond investors on the same side (the deflationary) of the boat.

It didn’t take much for this prediction to start coming true: just 48 hours later, following a much stronger than expected June payrolls number which beat every sellside forecast, 10Y Treasury yields exploded higher in a 6-sigma move that saw massive paper losses for those who were long the curve as government bond yields unwound much of the decline triggered by Lagarde’s nomination for the ECB presidency earlier on the week.
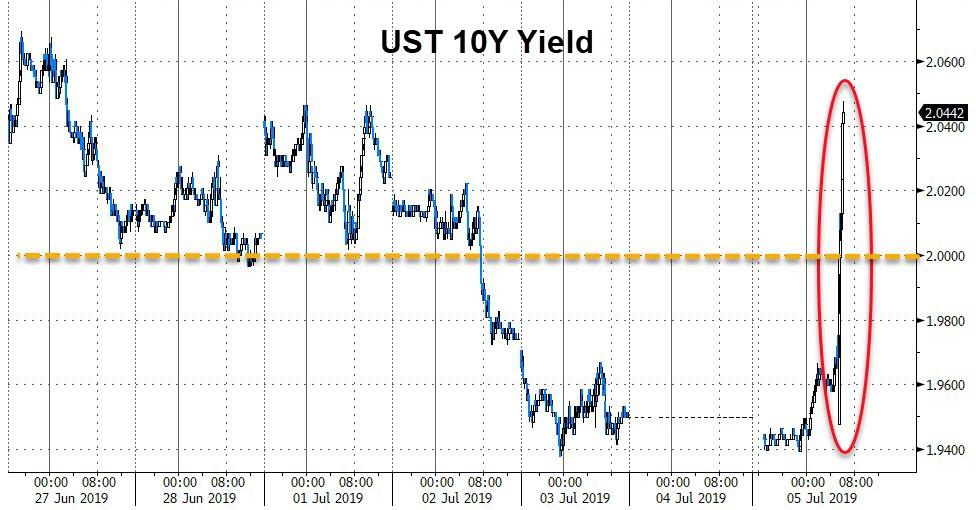
And, as we had also warned on Wednesday when we said that “so much debt has been sold at low yields that even a modest bump in yields near record lows “could inflict a world of pain for traders the world over“, rates traders found out the very hard way just what record duration truly means.
Furthermore, as a result of the huge payrolls beat which crushed expectations for 2 rate cuts in July, bond volatility also continued to creep higher, continuing a trend that started in March. As a result, JPMorgan’s Nick Panigirtzoglou picks up where we left off and in his weekly “Flows & Liquidity” report, writes that the rise in bond volatility coupled with a still low level of government bond yields are raising questions about the risk of a bond tantrum from here, and asks – seemingly in response to our prior article – “how vulnerable are government bond markets to a tantrum or VaR shock similar to the ones we saw in May 2013, October 2014 and November 2016 in US rates, April 2013 in Japanese rates or April 2015 in Euro rates?”
What is worth noting first is that these VaR shocks did not necessarily have a fundamental trigger; some examples:
- In October 2014, a violent capitulation on short positions at the front-end of the US curve had caused a collapse in UST yields.
- In April 2013, profit-taking in long duration exposures post BoJ’s QE announcement caused a sharp rise in JGB yields.
- In April 2015 an unwinding of extreme long positions in the 30y Bund futures contract caused a spike in euro area government bond yields.
So what, JPMorgan would like to know, is causing these VaR shocks – seemingly without an immediate catalyst – and why are they happening more often? As JPM – and virtually every other bank has argued before – one of the unintended consequences of QE, via inducing structurally lower volatility, is a higher frequency of volatility episodes or VaR shocks: in simple terms, investors who target a stable Value-at-Risk, which is the size of their positions times volatility, tend to take larger positions when volatility is low. But the same investors are forced to cut their positions when volatility rises or hit by a shock, triggering self-reinforcing, volatility-induced selling.
Add to that the proliferation of VaR sensitive investors, such as hedge funds, mutual fund managers, risk parity funds, dealers and banks, and the sensitivity of bond markets to self-reinforcing, volatility-induced selling soars. These investors set limits against potential losses in their trading operations by calculating Value-at-Risk metrics.
As an aside, as JPM explains, Value-at-Risk (VaR) is a statistical measure that investors use to quantify the expected loss, over a specified horizon and at a certain confidence level, in normal markets. Historical return distributions and historical market volatility measures are often used in VaR calculations given the difficulty in forecasting volatility. This in turn induces investors to raise the size of their trading positions in a low volatility environment, making them vulnerable to a subsequent volatility shock. Or, as we said previously, the amount of debt sold at record low yields has made it so that even a modest bump in yields near record lows “could inflict a world of pain for traders the world over.”
So when one day the volatility shock arrives following this jump in yields due to an unexpected inflationary catalyst or “just because”, VaR sensitive investors cut their duration positions as the Value-at-Risk exceeded their limits and stop losses are triggered.
That is known as a Var Shock. This volatility induced position cutting becomes self-reinforcing until yields reach a level that induces the participation of VaR-insensitive investors, such as pension funds, insurance companies or households.
Looking at the historical record, the VaR shock in the JGB market in April 2013 contained most of the above characteristics. By looking at quarterly Flow of Funds data from the BoJ, it was Japanese banks, Broker/Dealers and foreign investors who sold JGBs at the time. And it was VaR insensitive investors, such as Pension Funds and Insurance Companies and Households (via investment trusts) who absorbed that selling along with the BoJ. Similarly, the May 2013 UST taper tantrum or the Bund VaR shock of April 2015, was driven by unwinding of long duration positions by banks, hedge funds and asset managers, including trend following investors such as CTAs.
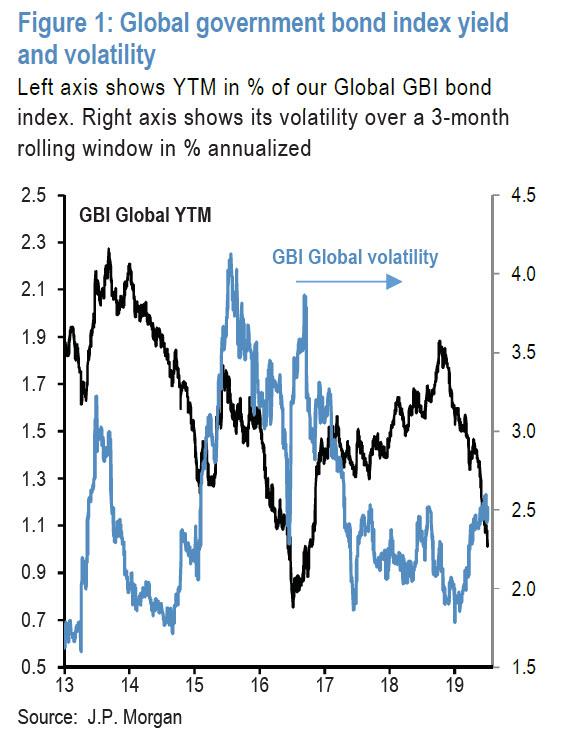
It is also worth noting that a common feature of these bond tantrums (or VaR shocks) was that bond volatility started creeping higher ahead of the shock, which once unfolded caused volatility to spike to even higher levels, in such a reflexive fashion it would make Nassim Taleb smile. The next chart shows that bond volatility has been creeping up for months now and rose further following Friday’s US payroll report.
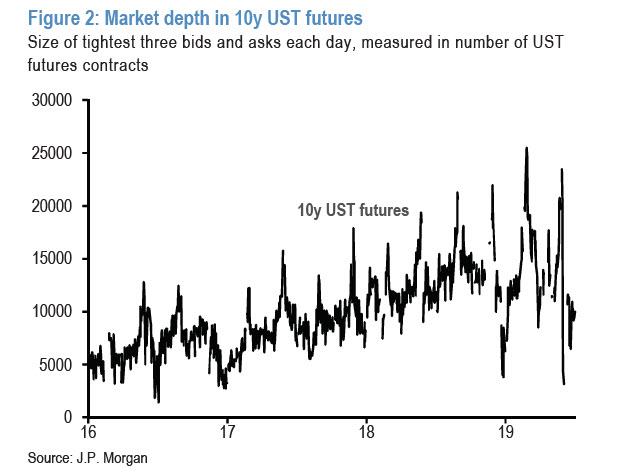
According to Panigirtzoglou, another common feature of previous bond tantrums or VaR shocks was a deterioration in market liquidity ahead of the shock. There is some evidence of a deterioration in the current conjuncture by looking for example at our market depth proxy for 10y UST futures shown in the next chart. This market depth measure, based on the size of the tightest three bids and asks each day measured in number of contracts, has unwound this year much of the previous improvement seen during 2017 and 2018.
A third common feature of previous bond tantrums or VaR shocks has been position vulnerability by VaR sensitive investors such as hedge funds and asset managers including CTAs who are typically active participants in futures markets. Predictably, JPM currently sees several bond position vulnerabilities by such VaR sensitive investors:
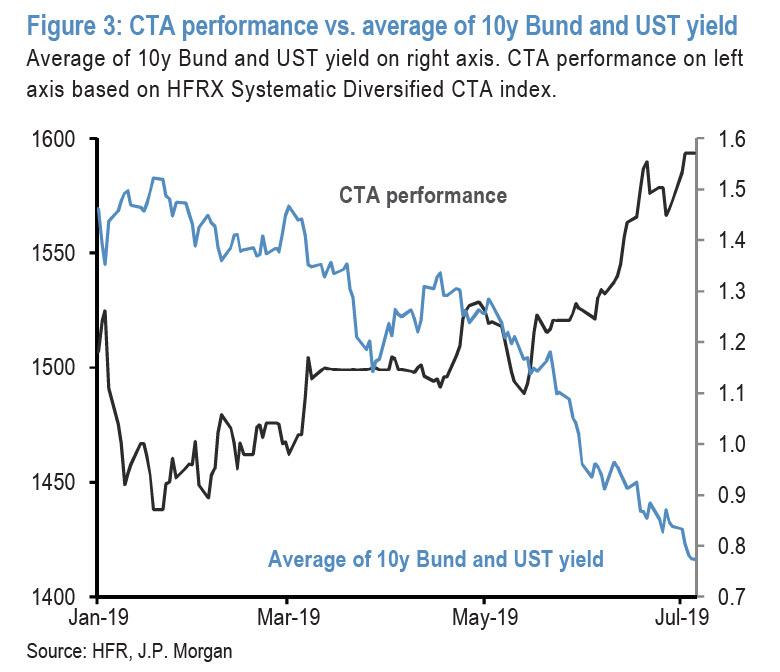
- 1) Movements between government bond yields and the HFRX Systematic Diversified CTA index have almost mirrored each over the past two months or so. This is shown in Figure 3 which depicts a CTA performance index against the average of 10y UST and Bund yields. The CTA performance index spiked over the past two months suggesting that CTAs have been increasingly benefiting from the bond rally. A likely overhang of long duration positions by CTAs is also suggested by JPM’s momentum signals for 10y UST and Bund futures. These momentum signals have been rising and currently stand at pretty high levels for USTs and very extreme levels for Bunds.
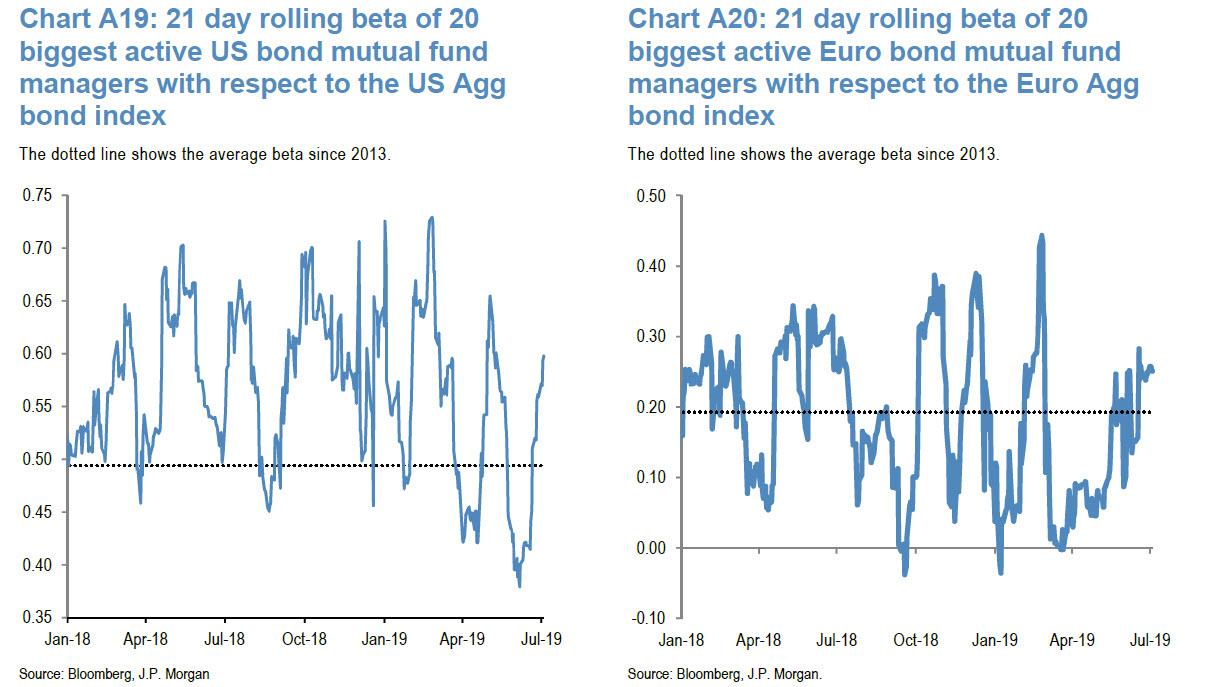
- 2) Real money managers appear to be also long duration at the moment as shown by the next two charts. These charts show that the biggest active bond mutual fund managers have a beta to bond indices that is above average in both the US and Euro area.
- 3) JPM’s European client survey, which tends to be less volatile and to exhibit clearer medium-term trends than its US counterpart, shows an unusually large increase in the long duration exposures by the bank’s clients over the past few months.
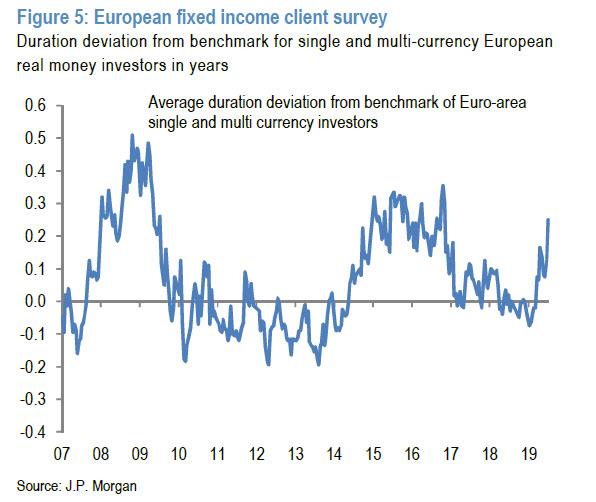
Making matters even more ominous, the current long duration positioning is not far from the highs seen in April 2015 ahead of the Bund tantrum at the time.
Overall, JPM concludes that “the above evidence points to significant risk of an abrupt bond reversal going forward.” But as Panigirtzoglou notes, there is another factor that is raising this risk at the moment which did not always feature in previous bond tantrums: bond supply.
The Flows and Liquidity author had argued back in April that there was a deterioration in the bond supply/demand balance of around $300BN for 2019. Due to stronger bond demand by banks and reserve managers so far this year, he is now revise this deterioration estimate lower to $100bn. Although a lot more modest than the $850bn deterioration in the bond supply/demand balance seen in 2018, this $100bn deterioration would still imply small upward pressure on bond yields this year which contrasts with the large 60bp YTD decline in the yield of the Global Agg bond index.
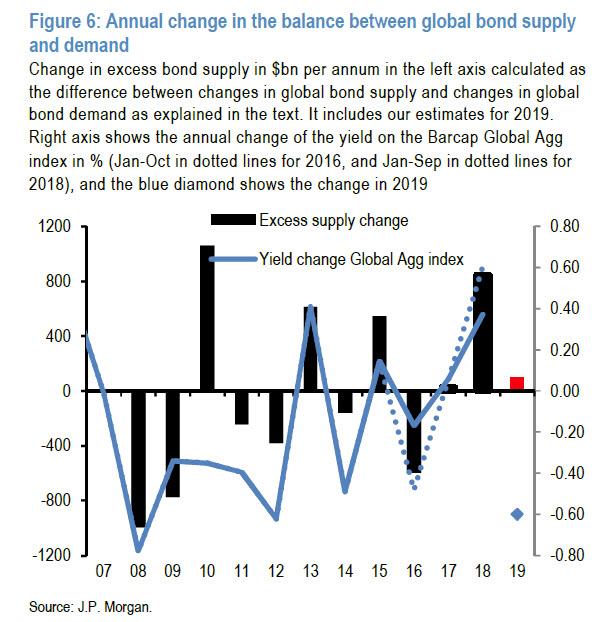
In JPM’s concluding opinion, “the large discrepancy between its estimated bond supply/demand balance for 2019 and the YTD decline in bond yields poses a challenge for bond markets going forward as it suggests that the large 60bp decline in global bond yields YTD looks rather unsustainable.”
One final note of caution from JPMorgan: “any abrupt bond selloff is unlikely to be favorable to equities given the support that equity markets received from the strong rally in bond markets in recent months.”
And now, we await as that other JPM quant, Marko Kolanovic, slams his co-worker for daring to spread such pessimistic fake news.
via ZeroHedge News https://ift.tt/2JHkjPR Tyler Durden