Much has been made about the spike this year in job cuts probably because the other labor reports such as the BLS monthly report and the weekly jobless readings have been relatively strong. Layoff announcements can be thought of as a leading indicator because the announcements occur before they happen. The spike is no longer happening, so the bears don’t have that point to add to their thesis.
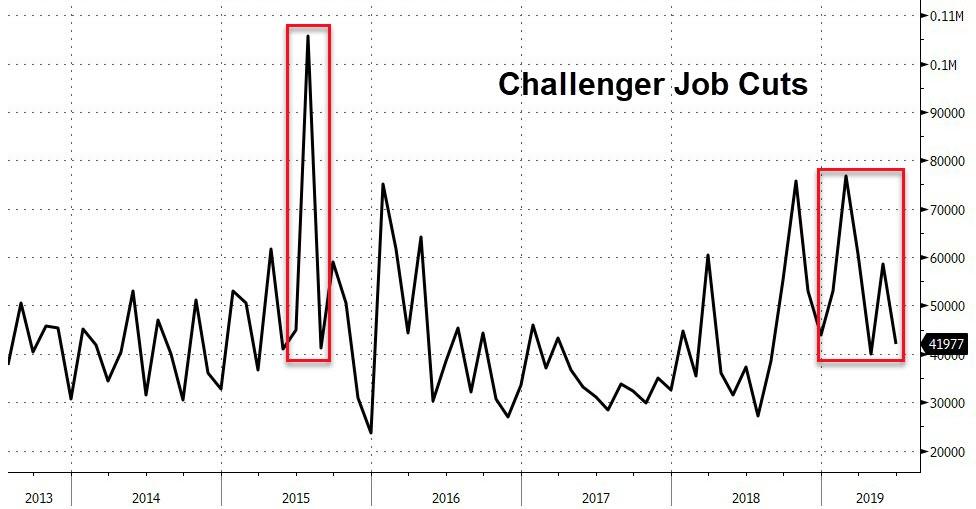
As you can see in the chart below, the number of job cuts in June fell from 58,577 to 41,977.
BUT…
This report is highly volatile and can be manipulated by a few big companies. That’s why it’s best to look at quarterly averages. In this case, it tells us the same thing as quarterly cuts fell 26% in Q2. There were 190,410 cuts in Q1 and 140,577 cuts in Q2.
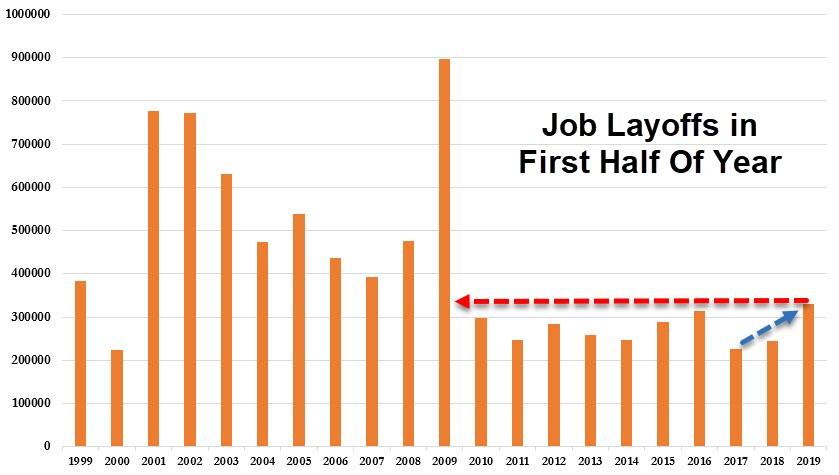
On the other hand, year to date cuts are still up 35% from last year and this is the highest first half total since 2009.
As you can see in the first chart above, the biggest spike in the past 4 years occurred early in the 2nd half of 2015. Is that what is coming in H2 2019?
via ZeroHedge News https://ift.tt/2XRjIUE Tyler Durden