Class 8 heavy duty truck orders were down for the eighth month in a row, falling a stunning 70% in June to 13,000 units, according to FTR data. The figure was up 20% sequentially, but still follows a 71% decimation in May. Jefferies’ Stephen Volkmann wrote in a note that the figures indicate a SAAR of ~178,000 Class 8 trucks and noted that the sequential growth compares to a sequential drop of 27% in May, when SAAR estimates were 139,000 units.
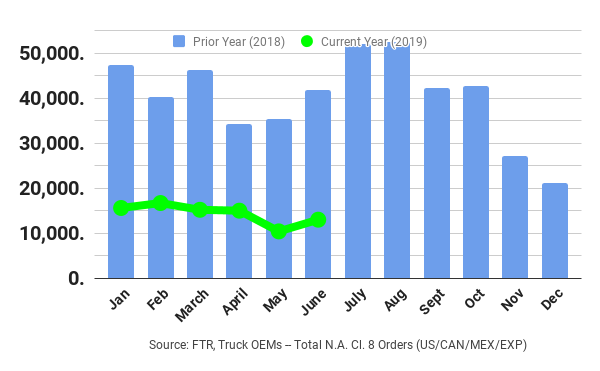
Kenny Vieth, ACT’s President and Senior Analyst said: “Fraying freight market and rate conditions along with a still-large Class 8 order backlog contributed to the worst NA Class 8 net order performance since July of 2016. May saw NA Class 8 orders fall below the 15,900 units averaged through the year’s first trimester, and year-to-date Class 8 net orders have contracted 64% compared to the first five months of 2018.”

The industry has been dealing with bloated backlogs as a result of aggressive ordering in 2018, coupled with headwinds from the ongoing trade war and the onset of a recession.
The good – and bad – news is that the backlog is starting to decline, and is expected to continue eroding until late summer. However, there is still downside risk for the industry in 2020 as a result of a slowing manufacturing, coupled with recessionary caveats.
On the medium duty market, Vieth commented: “While the US manufacturing/freight economy has been droopy since late 2018, the medium-duty market continues to benefit from the underlying strength in the consumer economy. In May, NA Classes 5-7 net orders were 19,300 units, down 21% year-over-year and 19% from April. One has to look back 22 months to find a weaker medium-duty order month on an actual basis or just 2 months when looking at the data on a seasonally adjusted basis.”
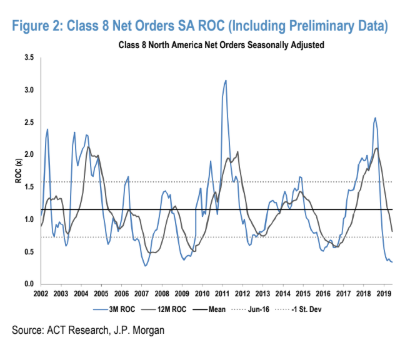
And according to a note by JP Morgan, forward looking indicators are still mixed:
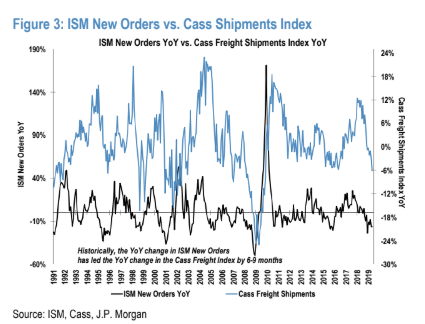
According to our analysis, the New Orders component of the ISM Manufacturing Index tends to be the best leading indicator of future freight trends and truck demand. Specifically, the year-over-year change in New Orders has historically led the year-over-year change in the Cass Freight Index (our preferred broad-based indicator of freight trends) by 6-9 months. The ISM New Orders index was 50.0 in June, down 20.6% YoY. The Cass Freight Index was down 6.0% YoY in May (the latest month available). We note though that the Cass Freight Index includes rail freight and may be less of an indicator of overall freight, so we also look at the ATA Total Loads SA Index, which increased 0.8% YoY to 108.6 in May (vs. up 4.4% YoY in April). Additionally, the Cass Truckload Linehaul Index (which measures the changes in linehaul rates) was up 1.2% YoY in May.
Last month, order data from ACT Research showed that the industry booked just 10,800 units in May, down 27% sequentially, but also lower by a staggering 70% year-over-year. YTD orders are down 64% compared to the first five months of 2018.
via ZeroHedge News https://ift.tt/2JunHgI Tyler Durden