There was a startling revelation in yesterday’s GDP revision: according to the preliminary Q2 GDP results, implied operating profits for the period totaled $1,900 billion, down 5% from Q1, which would represent the third consecutive quarterly decline, and off over 7% from the year ago levels, one the largest declines recorded in several years. Yet, as ugly as the Q2 numbers appear to be on the surface, what are even more troubling are the sharp downward revisions for the last two years. According to the annual GDP revisions operating profits for 2017 were lowered by $93 billion, or 4.4%, and profits for 2018 were reduced by a whopping $188 billion of 8.3%.

The revised corporate profit numbers show that contrary to conventional wisdom that corporate profits have been increasing, operating profits peaked in Q3 2014 and have been moving sideways ever since, before declining over the past year. Operating profits in the GDP accounts and S&P 500 operating profits over the long run track fairly close to one another, although there can be large differences in any given year. Yet, what is truly bizarre is that over the past 5 years operating profits have gone nowhere – and have in fact declined – while during this period S&P 500 prices have increased over 50%.
How is that possible? Simple: this is where the Fed steps in with the oldest trick in the book – multiple expansion.
As Goldman’s David Kostin writes in his latest Weekly Kickstart piece, markets are currently discounting 65 bp of easing by the end of 2019 and an additional 35 bp of easing by year-end 2020. Of course, as any Finance 101 textbook will explain, stock prices are a function of two things: profitability and interest rates. And since there has been no profit growth in five years, and virtually no profit growth is expected, the only variable that matters is interest rates, and from an investor’s standpoint, lower rates increase the value of equities, all else equal.
Which brings us to a startling observation: since there has been no EPS growth in 2019, more than 95% of the S&P 500’s YTD climb has been driven by an expansion in P/E multiples as 10-year US Treasury yields fell and the P/E multiple expanded from 14x to 17x. In other words, the reason why the S&P trades at all time high levels above 3,000 is just one: Jerome Powell.
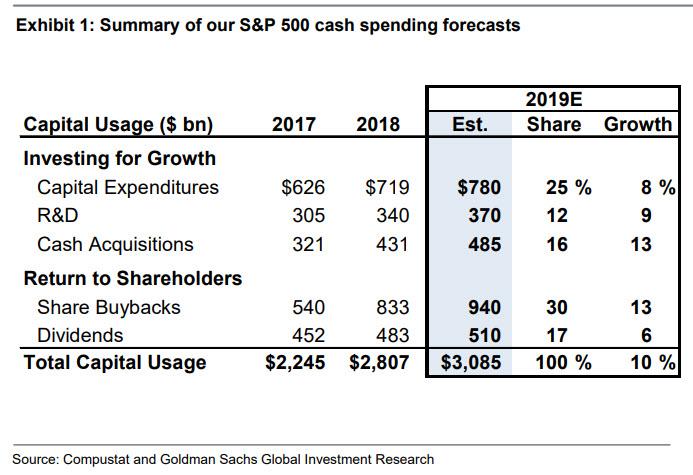
Of course, every finance major knows the reason why low interest rates are positive for risk assets: simply stated, they increase the capacity of firms to pursue investment spending. As Goldman notes, S&P 500 investment for growth (capex, R&D, and cash M&A) grew by a median of 8% during the three quarters following the start of the past four Fed cutting cycles, while spending beyond the first three quarters was determined by the health of the US economy. Following the 1995 and 1998 “insurance” cuts, investment for growth continued to grow for 12 quarters after the Fed’s first cut. In contrast, investment cratered following the 2001 and 2007 cuts as the economy fell into recession. (Incidentally, Goldman is quick to note that its economists see a low probability of recession in the near term, which supports the bank’s view that investment will continue to grow, and estimates S&P 500 capex (+8%), R&D (+9%), and cash acquisitions (+13%) will all grow during 2019.)
Besides spending on investment, companies have another option of how to spend excess cash: namely, return it to shareholders via buybacks and dividends. How has such activity changed before and after prior rate cuts?
According to Goldman’s analysis, buybacks continued to rise following the 1995 easing, but stopped growing following the start of the other three cutting cycles. Dividends have historically been stable following past Fed easing, only declining in aggregate as the economy headed into the Global Financial Crisis. Intuitively, companies have shown more willingness to withdraw spending on share repurchases than dividends.
Of course, this time may well be different, as even without a rate cut, share repurchases have continued to surge during 2019 and are expected to surpass the 2018 all time high, rising above $1 trillion. According to high frequency data from the Goldman Sachs repurchase desk, buyback executions have risen 26% year/year through mid-July, and Although S&P 500 repurchase authorizations have declined by 20% vs. the year-ago period, companies retain capacity to repurchase stock under multi-year authorizations. AS a result, Goldman estimates S&P 500 buybacks will climb by 13% to a new all-time high of $940 billion this year.
Which brings us to a second startling observation: for the first time in the post-crisis period, companies are returning more cash to shareholders than they are generating in free cash flow. During 2017, non-Financial S&P 500 firms returned 82% of free cash flow to shareholders in the form of buybacks (net of equity issuance) and dividends compared to 104% during the 12 months ending 1Q 2019. As Goldman further notes, net buybacks and dividends surged by 30% during the past 12 months while free cash flow (FCF) increased by a comparably modest 10%. Meanwhile, growth in FCF was not constrained by a surge in capital expenditures; S&P 500 cash flow from operations (CFO) also rose by 10% during this period. And since companies spent more on shareholder distributions than they generated, companies had to draw on their cash balances to finance spending growth.
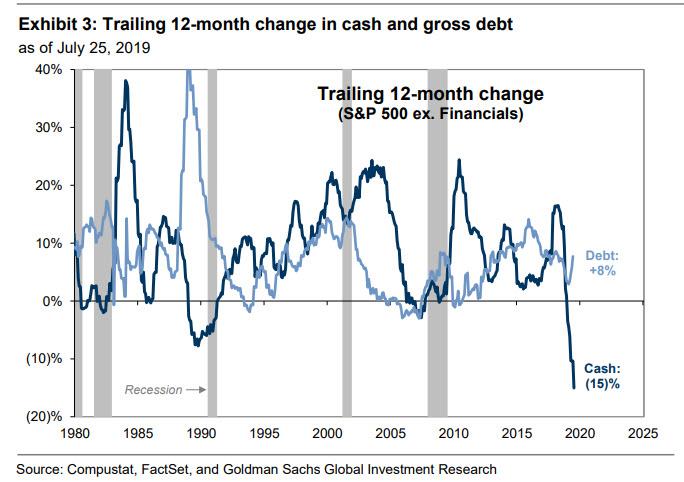
Which brings us to the most striking observation of the day: the $272 billion drop in non Financial cash balances in the LTM period represents the largest percentage decline since at least 1980 (-15%). As a percentage of assets, non-Financial cash balances have declined from 12.7% in June 2018 to 10.4% today – the lowest level since March 2010.

It’s not just cash that is plunging – this precipitous drop in cash balances has coincided with a sharp increase in corporate leverage. Four years after we first noted back in 2015 that stock buybacks were mostly funded by new debt issuance, when we published “The Amazing Chart Showing What All The Debt Issued This Century Has Been Used For“, showing that virtually all debt issued this century was used to fund buybacks, the trend continues and net leverage (net debt/EBITDA) for the median non-Financial S&P 500 stock climbed to a new all-time high in 2019. As Kostin writes, “part of the increase in net leverage reflects the sharp decline in cash balances, but gross debt outstanding also climbed by 8% during the past 12 months. Unless earnings growth accelerates materially, companies will likely continue to fund spending by drawing down cash balances and increasing leverage.“
Which brings us to one final observation: the polar opposite takes on how record corporate leverage is perceived on Wall Street.
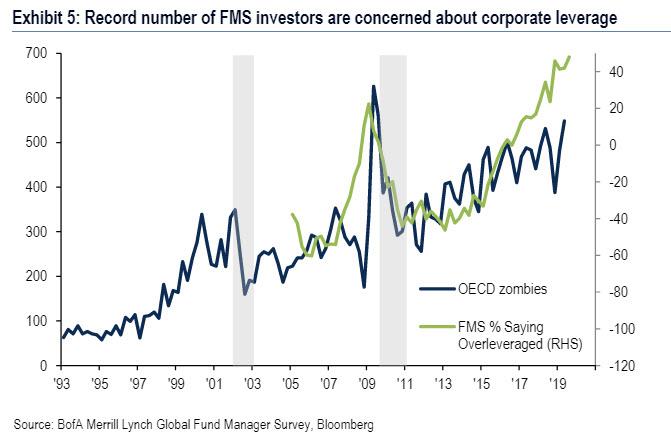
On one hand, earlier this month in the latest Bank of America Fund Manager Survey, we found that a record 48% of professional investors say corporates are excessively levered, while noting that the number of OECD zombie companies (those companies with an interest coverage ratio below 1) is at new post-GFC highs (548).
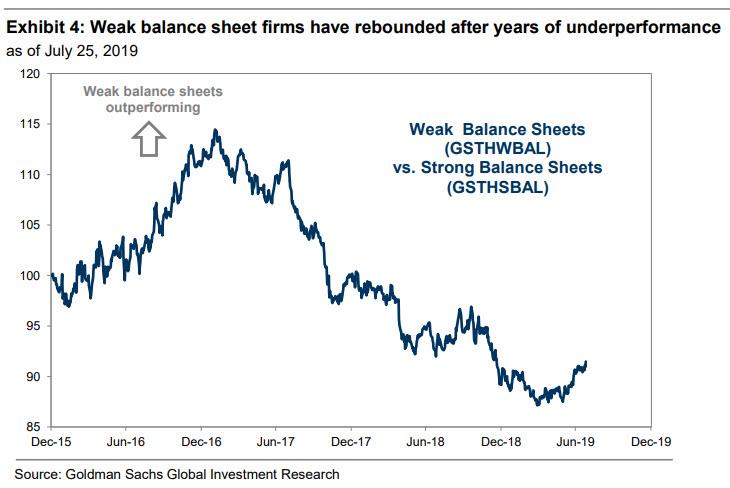
That, however, is not the case according to Goldman, which counters by noting that the recent outperformance of stocks with weak balance sheets suggests investors are comfortable with elevated leverage ahead of expected Fed easing.
So which is it – investors are freaking out about leverage or they are comfortable with it?
Judging by the market, Goldman has the upper hand for now because while stocks with weak balance sheets underperformed those with strong balance sheets by 24 pp (-3% vs. +21%) from the start of 2017 until the end of 2018 as the Fed tightened monetary policy, more recently, weak balance sheets have outperformed strong balance sheets by 450 bp since the start of June (+12% vs. +8%) as expectations for Fed easing have strengthened.
In other words, not only has the Fed pushed the S&P to an all time high by massively expanding PE multiples, but it is explicitly forcing improper capital allocation, by forcing investors to put money in companies that will be the first to default once the next recession finally hits.
There is just one risk: the fact that the market is expecting too much easing from the Fed, and as Kostin notes, Goldman’s economists believe that the Fed will be less dovish than implied by market prices. On the other hand, now that Powell is a slave to the market – an outcome he dreaded back in 2012 – it will only take a modest drop in the S&P for the Powell Put to be triggered again, resulting in yet another rate cut.
via ZeroHedge News https://ift.tt/2MjJDy8 Tyler Durden