New data suggests that the US is doing everything possible to repeat the 2008 financial crisis.
America’s middle class is sinking further into debt simply to maintain its middle class lifestyle, according to a new report from the WSJ , and its enabler has been none other than the Federal Reserve, which has continued to make borrowing extremely easy thanks to artificially low interest rates that are once again sliding lower.
Meanwhile, as incomes have remained stagnant for nearly two decades, the price of cars, colleges, houses and healthcare have all risen. In order to fill the gap, the middle class is turning to more debt.
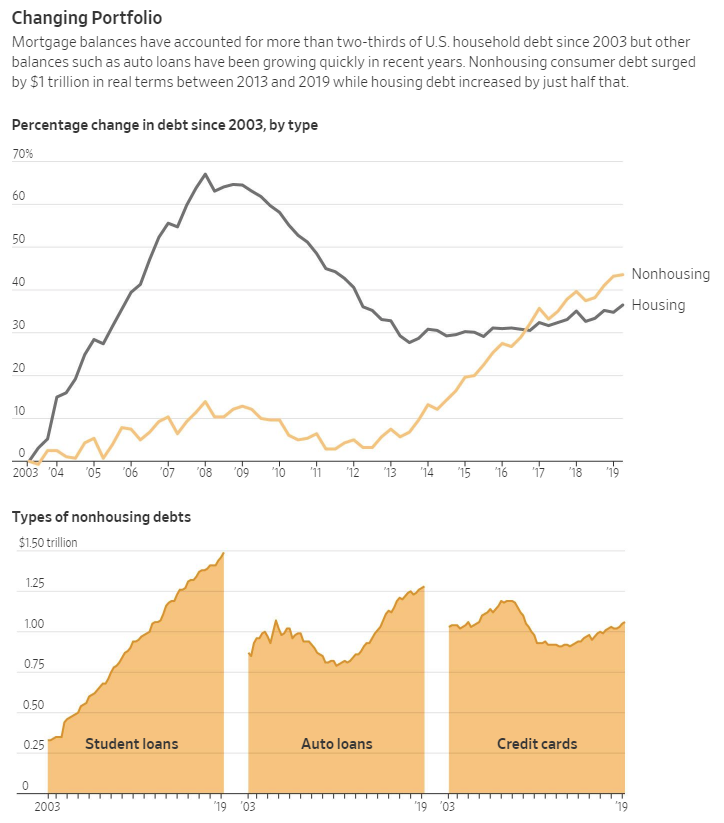
Consumer debt ex-mortgages – which comprises of credit card debt, as well as auto and student loans – is now at an astonishing $4 trillion, its highest level ever adjusted for inflation, while mortgage debt is rebounding after its post-financial crisis slide. More notably, student debt now totals about $1.5 trillion, exceeding credit card and all other types of debt except for mortgages.
Adjusting for inflation, auto debt is up about 40% to $1.3 trillion and the average loan for new cars is up an inflation-adjusted 11% in a decade, to $32,187. Due to peer to peer lending and tech based banks, unsecured personal loans are also popular yet again.
Amusingly the WSJ describes the rising debt levels as a “vote of confidence in the future”, instead of what it is – a desperate scramble to keep up appearances “for the Joneses” and to be perceived as well off, even if it means having a soaring credit card balance to show for it:
In one sense, the growing consumer debt is a vote of confidence in the future. People borrowing money today expect to have the income tomorrow to pay it back. Consumer debt tends to rise when borrowers feel secure in their jobs.
Of course, if job losses start to occur, the debt load could easily become unsustainable for many borrowers, which would then result in missed payments, delinquent loans and lenders writing off balances.
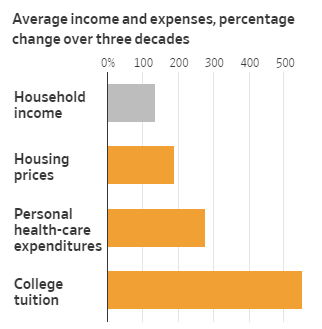
Some perspective: the median U.S. household income was $61,372 at the end of 2017, which is barely above the 1999 level when adjusted for inflation. Not adjusted for inflation, this number rose 135% over the last three decades – but over the same period, average tuition was up 549% over the same period of time. Healthcare expenditures were up about 276% between 1990 to 2017. Average housing prices were up 188% over those same three decades.
Adam Levitin, a Georgetown Law professor who studies bankruptcy, financial regulation and consumer finance said: “The costs of staying in the middle class are going up.”
U.S. households with credit card debt owed $8,390 in Q1 2019, which is up 9% from 2015 adjusted for inflation.
And while borrowing to fund a degree or a house, which could both provide an eventual return on investment, can sometimes be smart decisions, borrowing for everyday consumption or for assets that depreciate (like cars) makes its harder to save and invest.
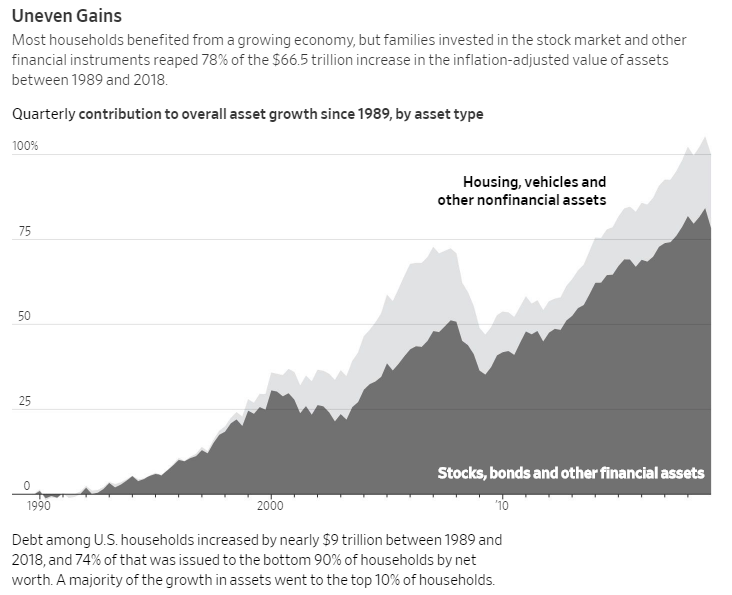
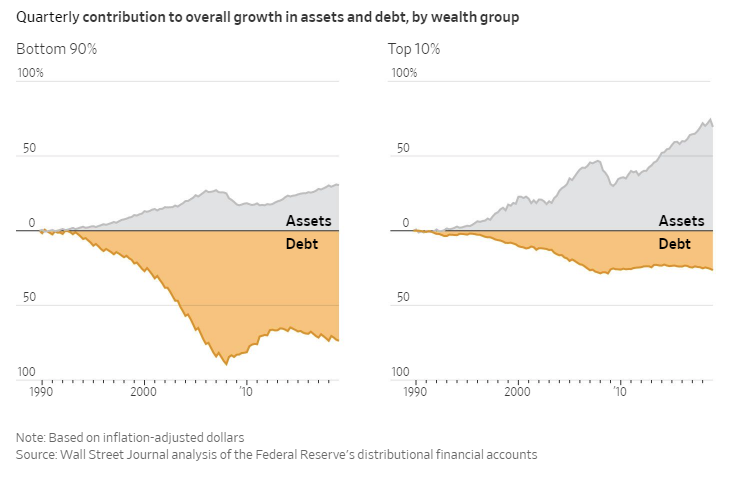
Despite the U.S. economy nearly doubling in size from 1989 to 2016, the gains in assets owned were “heavily skewed” toward the highest earners, according to the report.
The median net worth of households in the middle 20% of income rose 4% in inflation-adjusted terms to $81,900 between 1989 and 2016, the latest available data. For households in the top 20%, median net worth more than doubled to $811,860. And for the top 1%, the increase was 178% to $11,206,000.
Put differently, the value of assets for all U.S. households increased from 1989 through 2016 by an inflation-adjusted $58 trillion. A third of the gain—$19 trillion—went to the wealthiest 1%, according to a Journal analysis of Fed data.
Cris deRitis, deputy chief economist at Moody’s Analytics said: “On the surface things look pretty good, but if you dig a little deeper you see different subpopulations are not performing as well.”
And while consumers still aren’t as burdened by debt as they were in Q4 of 2017, they’re heading in the wrong direction. In Q4 2017 households devoted 13.2% of their disposable income to debt service – that number is about 9.9% now, mostly due to lower interest rates. Other debt, including auto and student loans, consumed about 5.7% of disposable income in Q1 versus 4.9% at the end of 2012.
Of course, while rates can always go even lower, the overarching problem is that instead of deleveraging, US consumers are instead adding on more and more debt in the hopes that rates never go up. Come to think of it, that precisely what corporations and sovereign nations are doing as well.
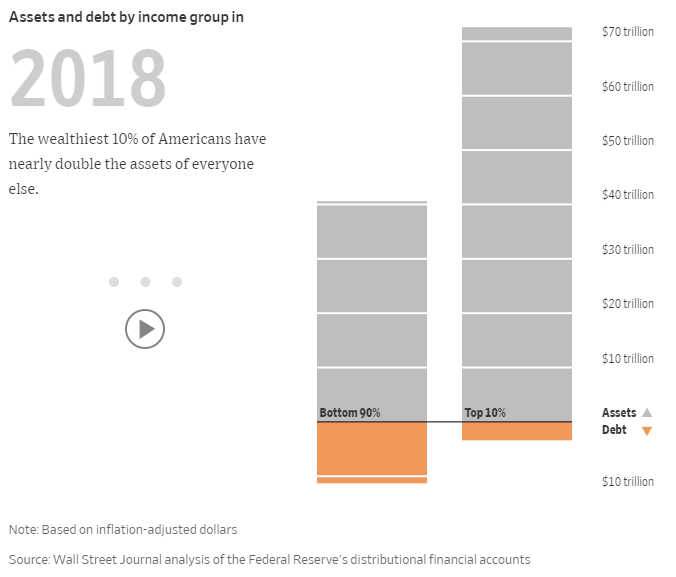
Finally, for for those that have an problem visualizing the inequality gap, those who don’t realize that the quarterly net worth exercise is meaningless and the result of averaging data when in reality only the top 10% benefit, and those that argue that the US society, not just its financial elites, is far better off than 2008, here’s the one chart that will set you straight:
via ZeroHedge News https://ift.tt/33gGQvO Tyler Durden