There is once again confusion as to what is going on in the markets: Monday’s violent selloff, which was accompanied by extremely heavy volume and which saw both active funds, systematic investors and passive entities liquidating, has given way to the now traditional, no participation levitation, the consequence of buybacks and algos forced to chase gamma. The result is that stocks are virtually unchanged for the week despite a huge volume imbalance to the downside, as if the sellers are just biding their time when to start hitting bids again.
As Nomura’s Masanari Takada puts it best, “investors in US equities seem not to all be on the same page” and he adds that right now is “precisely when one might expect the US market to see the sort of spontaneous rebound that often follows a selloff, and we think the market is likely to resist further downside thanks to a combination of bargain-hunting by fundamentals-oriented investors and contrarian buying by ultra-short-term traders through perhaps 15 August.”
However, as the Nomura quant warns, if key market indices fail to climb back above trend-chasers’ major trigger lines (at around 2,960 for the S&P 500 and around 7,720 for the NASDAQ 100), then he would expect “trend-followers that are currently sitting on unrealized losses (including CTAs) to start exiting their long positions in equities at a quickening pace.” Meanwhile, as of now, the Nomura quant merely sees the rebound in US stocks as a technical rally that looks like no more than a bump in the road on the way down.
Why? Because as shown in the charts below, stock market sentiment, both in the US and globally, is parked well into negative territory. This evidence of risk-avoiding sentiment among investors implies that risk appetite has eroded substantially, according to Nomura.

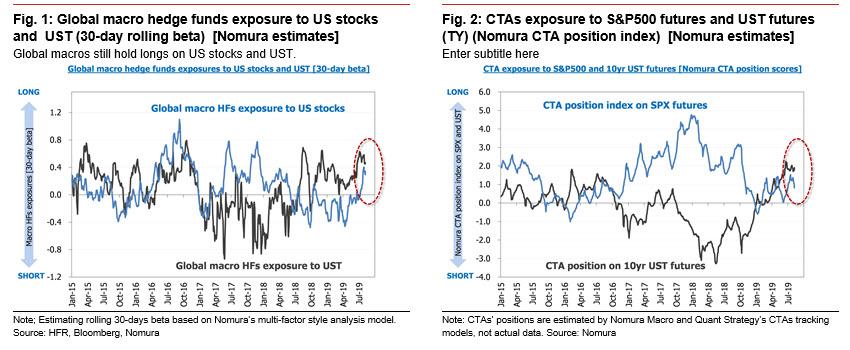
Worse, there is confusion within the trading community what to do here, as speculative traders are not aligned in their trading stances. According to Nomura, contrarian buying at the moment is probably being led by 1) ultra-short-term investors (with investment horizons of around 10 days) targeting a near-term reversal, and 2) global macro hedge funds that are still bullish on fundamentals.
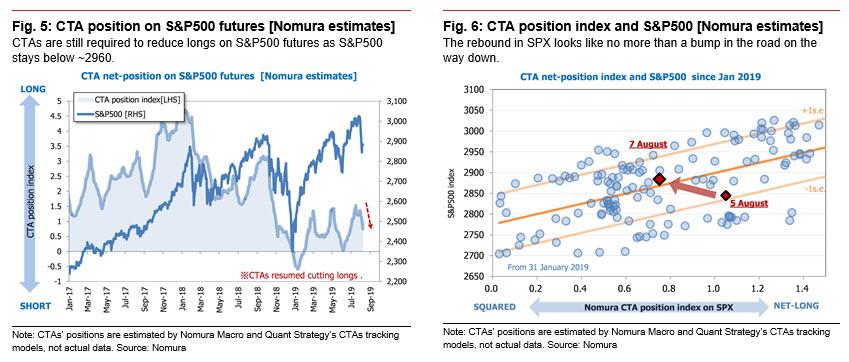
Among systematic trend-chasers, however, CTAs stand ready to sell. Loss-cutting exits from long positions by CTAs will probably remain the order of the day for as long as the S&P 500 is below 2,960 and the NASDAQ 100 is below 7,720. The present market rebound could well turn out to be a mere technical rally if CTAs treat it as an opportunity to sell.
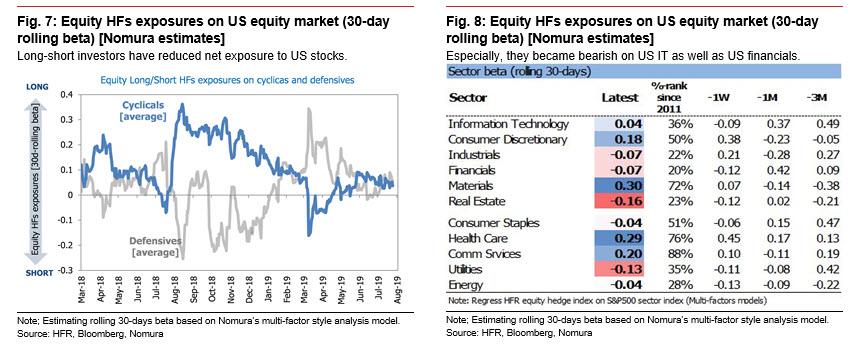
Meanwhile, traditional long/short funds have slightly pared their net long exposure, a continuation of the observation we made three weeks ago in “An Unprecedented Market Divergence: Robots Are All In Stocks As Humans Flee.” One factor here appears to be the progression of a defensive sector rotation as long/short funds scale back their long positions in cyclical sectors and add to their long positions in defensive sectors. Long/short funds had turned bullish on the IT sector and financials in July, but Nomura estimates that their net positions in these sectors now have already swung to being neutral or slightly short.
Meanwhile, in his latest note – bullish of course (“a short period of stabilization, markets will likely regain previous highs, and hence we see this sell-off as a medium-term buying opportunity”) – JPMorgan’s Kolanovic does a granular analysis of who are the sellers and buyers of stock here.
- First, on the seller (i.e. “negative impact”) side, Kolanovic notes that most outflows are expected to come from volatility-targeting strategies. This includes insurance annuity products, hedge fund platforms, risk parity funds and others. He further notes that “these strategies were running equity exposure at ~65th percentile, and not ‘maximum leverage’ as some have reported. Also for most of the days, bond and equity moves were offsetting, in part mitigating the impact on multi-asset portfolio volatility and speed of de-leveraging. However 3%+ move on Monday has triggered significant selling from these funds with more assets to be sold.
- Second, trend-following strategies were significant sellers on Monday, per Kolanovic, who adds that “these strategies had very low equity beta going into the sell-off. Equity positions were not at historical highs (and equity beta was very low in part due to short oil and industrial metal positions). As the equity indices breached short- and medium- term signals these funds rapidly sold equities (Monday). However, the risk of CTA selling going forward is low. Next leg of selling would come with breach of longer-term signals (e.g., 200d ma), which is now 3% below current level.” On the other hand, these strategies could also start buying equities if shorter signals turn positive (e.g., 50d and 100d ma), which are only 1-2% above current level.
- Thiid, as discussed on Monday, dealers option gamma positions turned very short on Friday. That was a significant driver of Monday’s sell-off. However, reversion of these flows helped move the market higher on Tuesday as we also pointed out earlier today. Short gamma exposure is not equity negative on its own (works both on up and down days), but will drive realized volatility higher, which is not positive for the market.
So who’s buying? Take a wild guess:
- First and foremost, accelerated buyback activity – as ~85% of companies exited blackout period, buyback activity has been increasing. More importantly, the majority of buyback activity is sensitive to stock price declines, and an 8% drop in SPX has activated accelerated programs, as we also discussed earlier today. According to JPM, average activity of ~$3 billion per day has likely tripled to nearly ~$10 billion of purchases per day. This on its own can meaningfully cushion volatility targeting selling pressure.
- Second, Kolanovic sees positive flows from fixed-weight portfolio trigger rebalances, to wit: “Most of fixed-weight portfolios rebalance on month- or quarter-end. However, many also have built-in triggers to rebalance immediately if equity-bond spread moves beyond a certain threshold. Equity drop of 7% and bond rally of 3% (+10% spread) would have triggered many of these rebalances leading to equity inflows.
- Third, as noted earlier, the equity beta of global hedge fund indices was very low going into selloff – it dropped to ~20th percentile from 60th percentile a few weeks before. At the same time, many real money managers (e.g., pension funds) have significant equity underweight and bond overweight. Due to this positioning, the JPM quant concludes that the large equity selloff/bond rally was expected to result in above-average level of opportunistic buying (e.g., buying the dip in tech stocks).
So what happens next? Well, in a market in which everyone now does only what everyone else is doing, should the low-volume levitation continue, expect the S&P to rally back to all time highs soon. Alternatively, if a short risk trigger emerges, or if the sellers reappear again in size, then the next stop in the S&P will be 2,800 and lower.
via ZeroHedge News https://ift.tt/2Th5BU3 Tyler Durden