Authored by Chris Hamilton via Econimica blog,
Summary
-
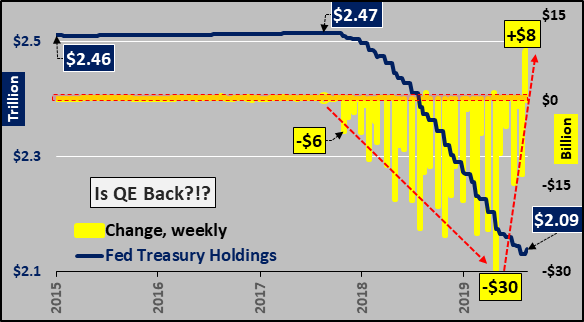
Federal Reserve holdings of Treasury’s has risen for the first time since QE ended in 2014.
-
Quantitative Tightening is over, but is outright QE back???
-
Ongoing “direct monetization” continues, with un-matched declines in Excess Reserves versus Fed held Treasury’s and MBS.
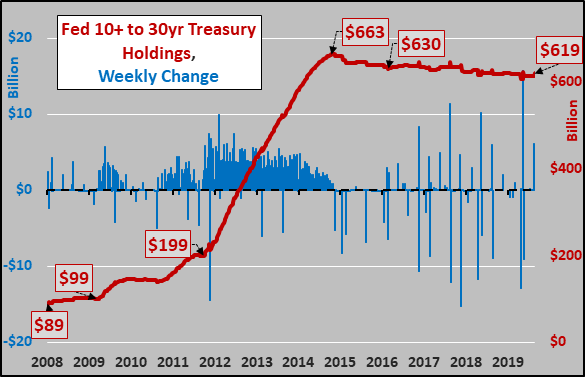
Interesting that this week, for the first time since QE ended way back in late 2014, Federal Reserve holdings of Treasury bonds rose (yellow columns, below). The $8 billion increase is the first seen since QE ended almost 5 years ago and comes after QT (quantitative tightening) had been decelerating since mid 2019. However, the outright increase in Treasury holdings is still a bit of shocker. Can’t say if this was a one off… but this deserves a bit more attention.
So what exactly was the Fed buying? Seven to ten year Treasury’s! The chart below shows the Fed’s mid duration holdings (red line) and the weekly change in those holdings (blue columns). The purchasing this week was only bested by a single week in 2011…when the Fed was feverishly running its QE program?!?
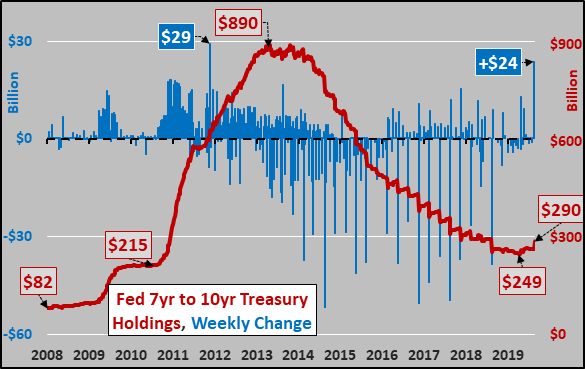
After a long period of selling/rolling off mid duration Treasury’s (red line below), late 2018 and early 2019 saw an end to the selling…and now a sudden burst of Federal Reserve purchasing coinciding with a sharp decline in the 10 year yield (shaded blue area).

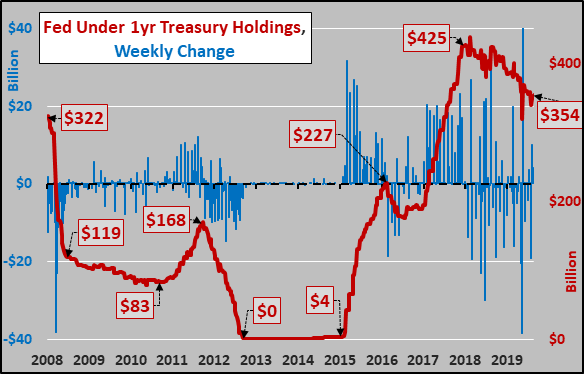
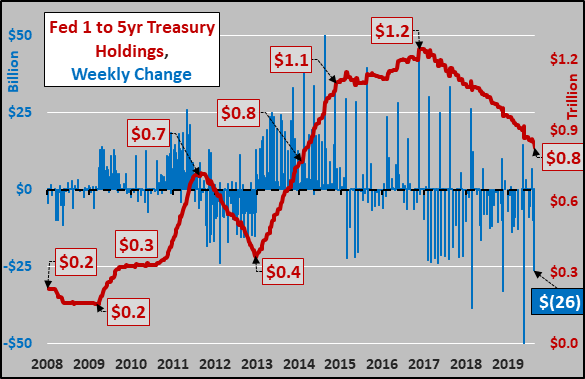
As for the shorter durations, the two charts below show the Fed’s holdings of Treasury’s under 1 year, and the 1 to 5 year holdings. No need to guess what the Fed is actively rolling off/selling.
And the unchanging (nearly zero roll-off since 2016) Fed holdings of over 10 year Treasury debt.
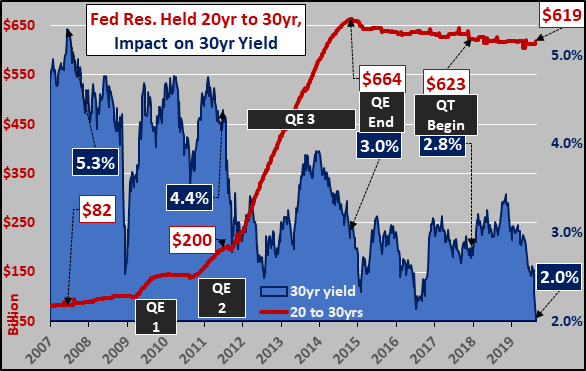
And the Feds long duration holdings versus the 30 year Treasury yield. The current move down in the long yield is exactly what was seen, in anticipation prior to QE1, QE2, and QE3. Hmmm.
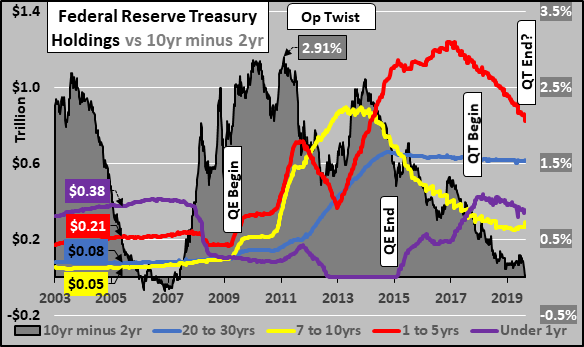
Charted below are the Fed Treasury holdings, by duration, since 2003 and the impact on the 10 year minus 2 year spread (shaded grey area). The real question isn’t is QT ending, but is QE 4 actually already starting? Purple line are Fed held T-bills, red line 1 to 5 year duration, yellow line mid duration, and blue line is everything over 10 year duration. The fact the Fed has allowed nothing to roll off from the longest duration holdings sure is interesting.
Below, ongoing declines in bank excess reserves versus far smaller declines in Fed held Treasury’s and Mortgage Backed Securities. Some call this $700 billion and growing disparity “direct monetization”, something the Fed said it would never do?!?
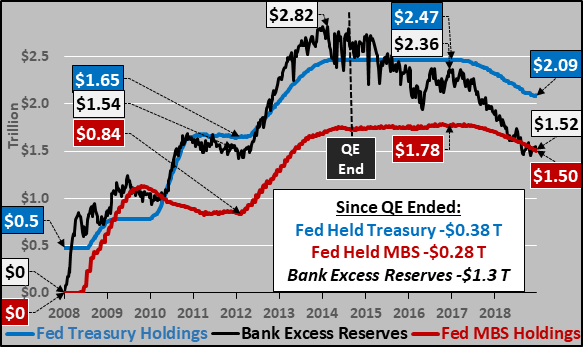
And now that QT appears to be over, will bank excess reserves continue falling providing an unofficial QE (with banks leveraging up the direct monetizaton) alongside a potential restart of the Fed’s QE?
Why is this happening? In short, organic potential for growth has been decelerating for half a century but central banks and federal governments are unwilling (unable?) to accept what growth the economy can provide.
They are instead artificially and synthetically pushing up economic growth and financial asset valuations. But every action has a reaction, and like Mother Nature, the more one messes with the economy, the greater the distortions become. Detailing the decelerating potential for organic growth, globally HERE and domestically HERE.
Why this is the end of the positive interest rate cycle…HERE
And why China is facing an existential crisis and has no possible means to compromise on a trade deal…HERE.
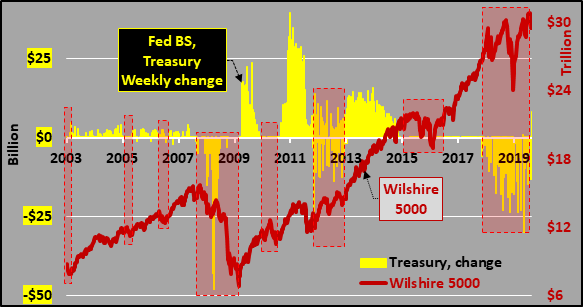
EXTRA CREDIT – For those curious what the correlation of Federal Reserve Treasury buying to equity valuations has been…chart below is Fed Treasury holdings versus the Wilshire 5000 (representing all publicly traded US equities). When the Fed buys, stocks go up…when the Fed holds or sells, stocks struggle (except for 2017, but that’s another story).
Invest accordingly.
via ZeroHedge News https://ift.tt/2U0T4nW Tyler Durden