It’s (relatively) different this time.
That phrase has sunk a thousand trade theses and more than one massively-levered hedge fund. But, as The Wall Street Journal notes, there is something very unusual about what has happened in recent weeks.
Seemingly unrelated areas of the market are trading in the same direction more frequently than normal, a trend that some investors say is contributing to recent volatility and could drive more gyrations in the future.
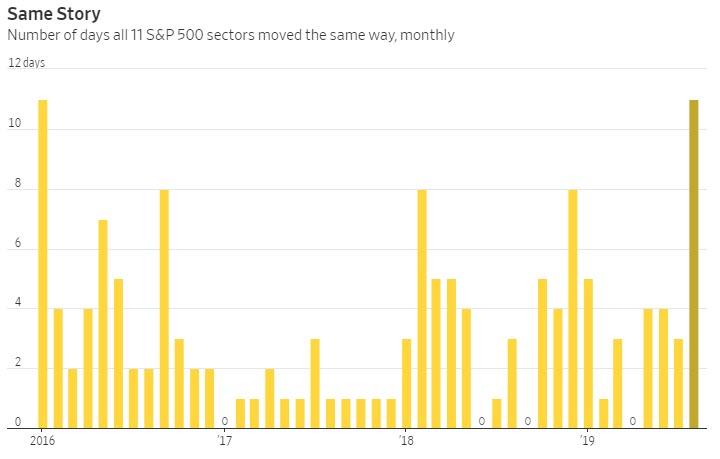
The S&P 500’s 11 sectors have either risen or fallen together during 11 trading sessions in August, the highest monthly incidence of such alignment since January 2016.
“It really is almost like an ongoing, rolling bet on the odds of recession,” said Dave Donabedian, chief investment officer at CIBC Private Wealth Management.
“If you’re a stock picker, that’s frustrating.”
This relationship is also very well highlighted by the so-called ‘implied correlation’ of the S&P 500. This indicator measures the relative demand for individual members of the index vs the index itself. The higher the index, the more driven by systemic index moves and not idiosyncratic company moves. The current level is the most systemically-driven since the collapse in stocks in December…
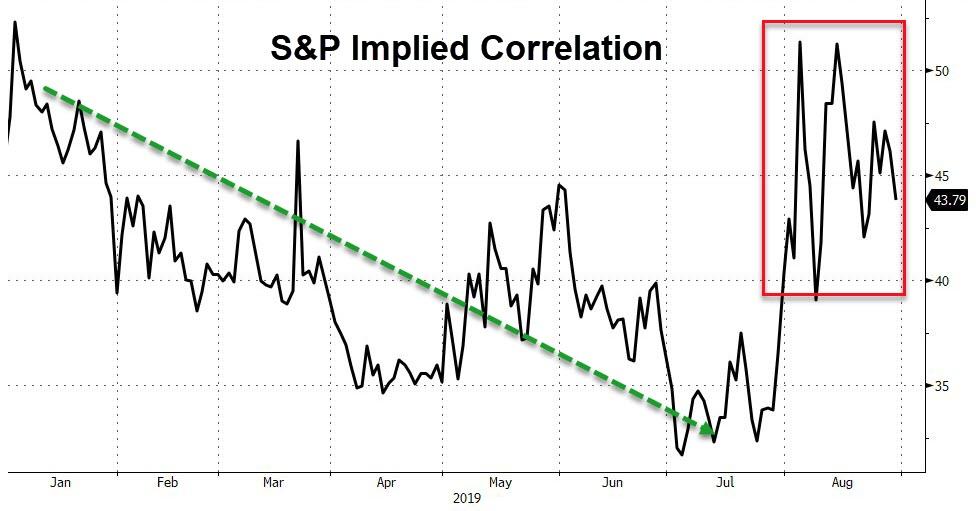
Source: Bloomberg
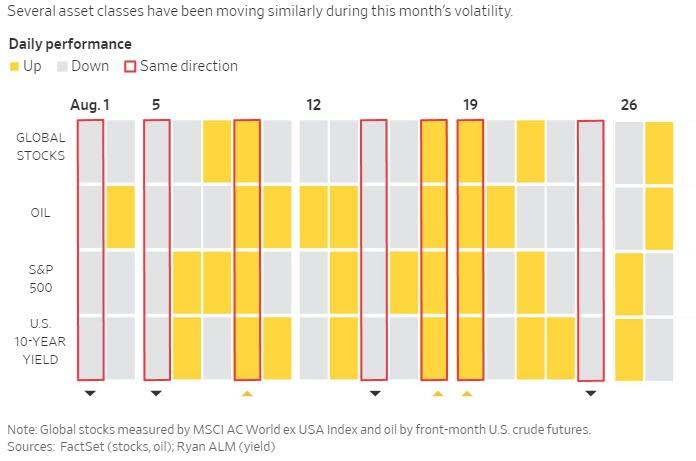
Other risky investments such as commodities and global stocks have generally been tracking moves in U.S. stocks, and as The Wall Street Journal notes, that is worrying investors who fear there will be few places to hide if risky investments fall suddenly, as they have following recent escalations in the U.S.-China trade war.
Oil prices, international stocks, and bond yields have traded in the same direction as U.S. stocks several times this month.
But lockstep market moves add to other warning signals that are causing some investors to protect against a bigger downturn. Those include a recent yield-curve inversion in which shorter-term Treasury yields eclipsed longer-term ones – a shift that has preceded past recessions – and a pullback in consumer confidence.
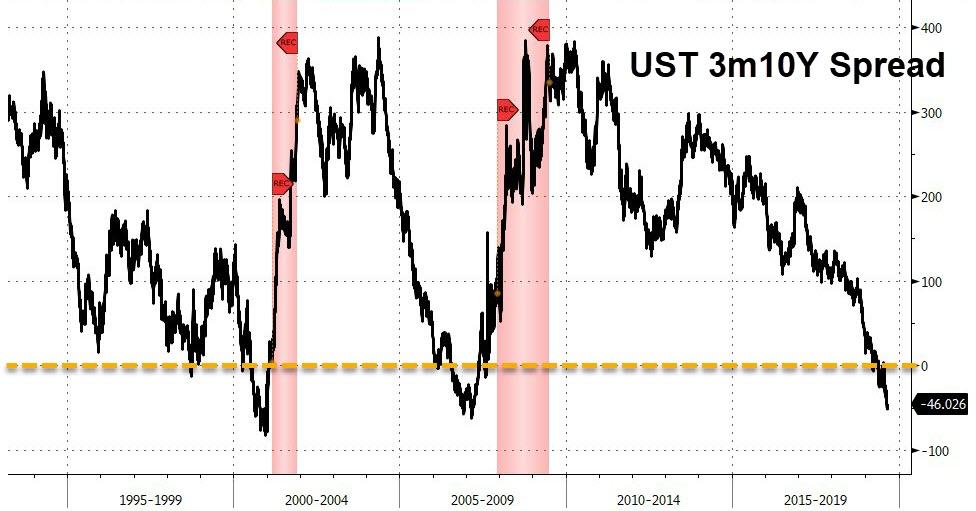
Source: Bloomberg
And it’s not just stocks that are correlating aggressively, the relationship between bonds and stocks is at its most negative (lower yields and higher stock prices or vice versa) since 2006…
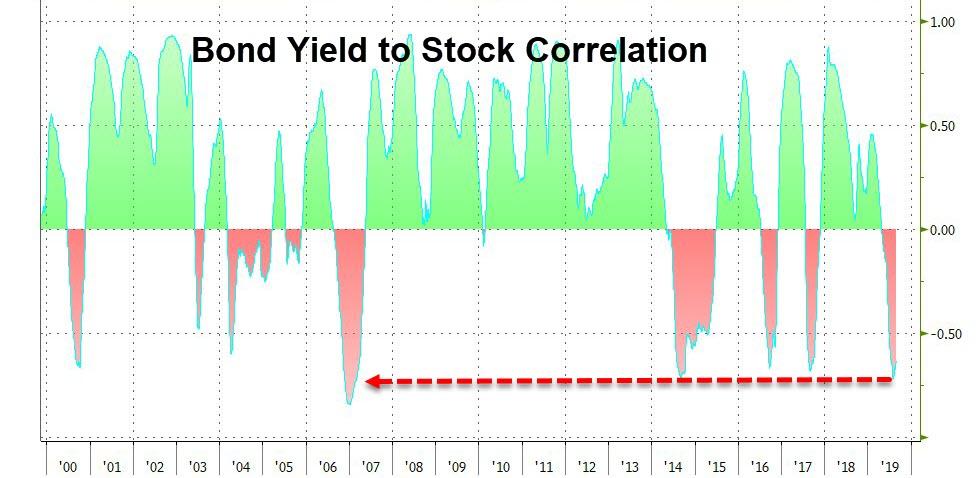
Source: Bloomberg
Picture another way, something has snapped (or is this a yuuge QE anticipation trade)
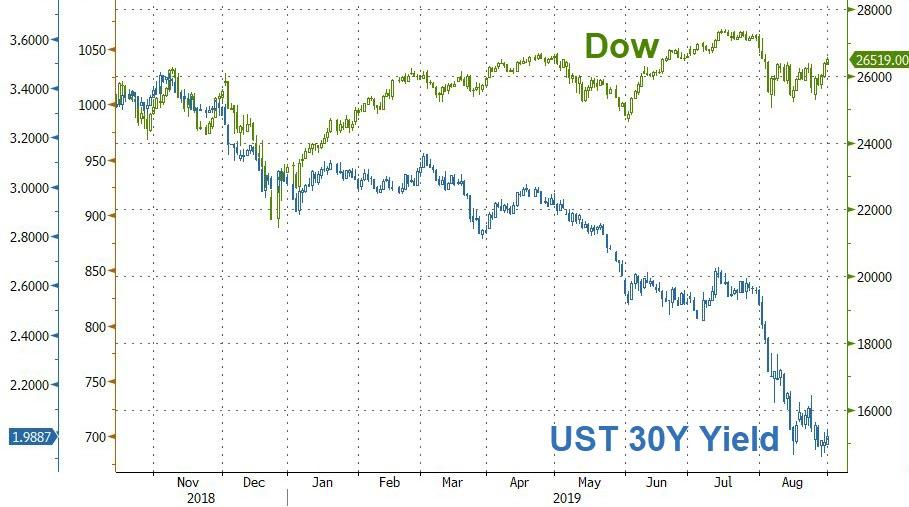
Source: Bloomberg
In light of this, former fund manager and FX trader Richard Breslow warns, equities can be, but certainly aren’t always, the arbiter of the state of things. Go back and read what was being written about them as late as the fourth quarter of 2007.
“It’s very difficult to gauge where things are going,” said Candice Bangsund, a portfolio manager at Fiera Capital.
“Sentiment remains extremely fragile.”
August marks the first month since September 2011 that the S&P 500 has fallen at least 2.5% on three separate days, according to Bespoke Investment Group. On each one, bond yields, global stocks and oil also fell, another sign that investors believe few corners of the market will be spared if the tariffs do indeed lead to a world-wide recession.
However, as Bloomberg’s Robert Fullem notes, for traders looking for a reason to bet against the epic run in Treasuries might want to consider that the rolling 30-day correlation between 10-year Treasury futures and the MOVE Index, a gauge of underlying volatility, rose to a record this week.
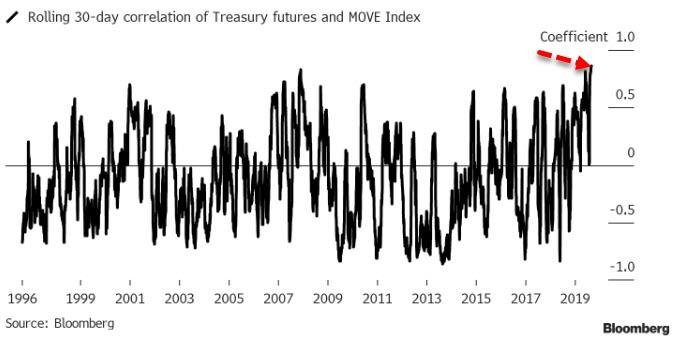
Source: Bloomberg
Market theorists say a surge in volatility may mark an end to a trend, suggesting it could be best to avoid Treasuries at these levels. The price-volatility correlation, which has generally been negative, rose above the prior peak seen in the run-up to the financial crisis of 2008.
The demand for safe-havens has been dramatic nevertheless as illustrated by the record high correlation between gold and US Treasury prices…
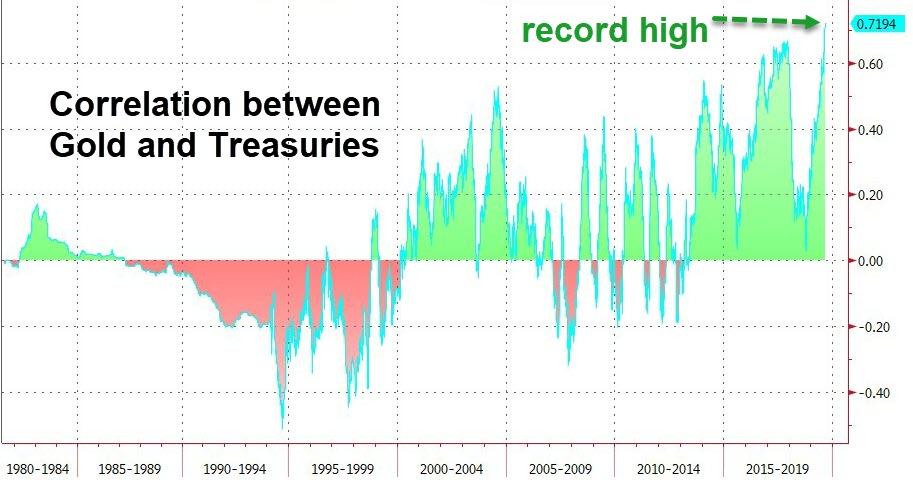
Source: Bloomberg
But gold appears to be moving in lockstep with a proxy for policy-maker pandemonium as the almost perfect correlation between the precious metal and global negative-yielding debt is extreme to say the least…
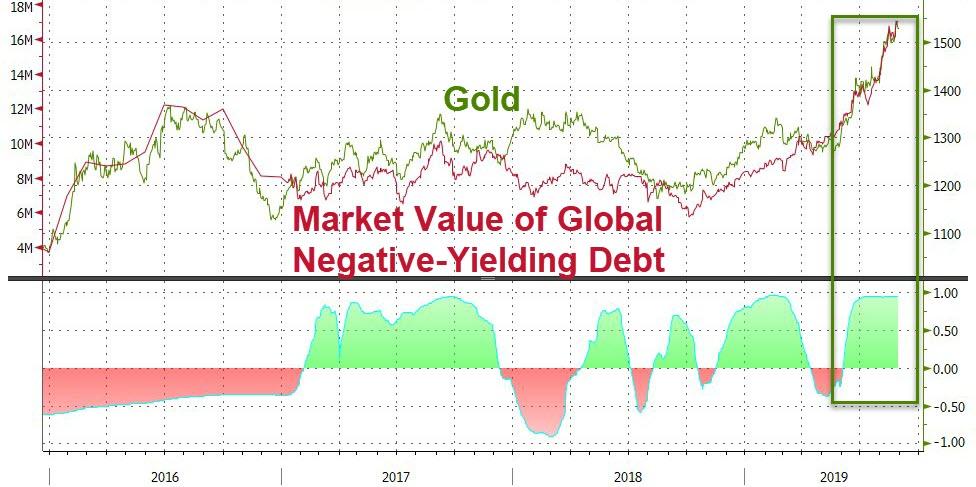
Source: Bloomberg
As WSJ concludes, investors have long pointed to lockstep market movements and the prevalence of crowded trades, like betting on popular technology stocks, as signals that the long-running bull market is vulnerable to a pullback. When momentum flips, an unwinding of those positions can swiftly drag down markets, these analysts say. That trend contributed to sharp market downturns in early 2018 and again late last year.
“It’s a lot for investors to digest,” said Emily Roland, co-chief investment strategist at John Hancock Investment Management.
“Our suggestion has been that investors probably need to adapt to this type of macro volatility and do what they can to not get whipsawed by these shifts that we’ve seen.”
However, there is at least one uncorrelated asset class that could provide cover in the event of a major market move. Markets and Bitcoin have dramatically decoupled after almost perfect correlation earlier in the month…
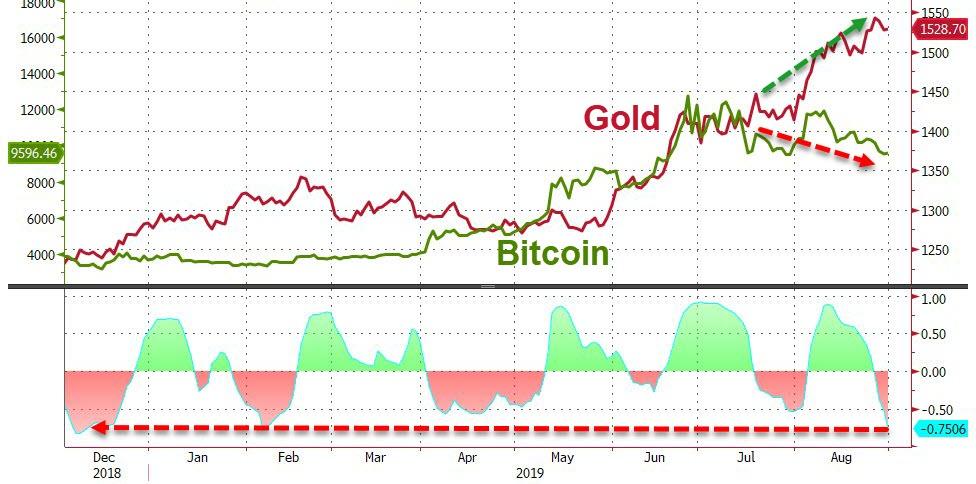
Source: Bloomberg
As one veteran trader warned, “it’s all the same trade… recession on-recession off, trade deal on-trade deal off… and the algos exaggerate the swings in either direction.”
via ZeroHedge News https://ift.tt/2PrMwAf Tyler Durden