According To Bank of America, This Is “The Most Important Chart In The World”
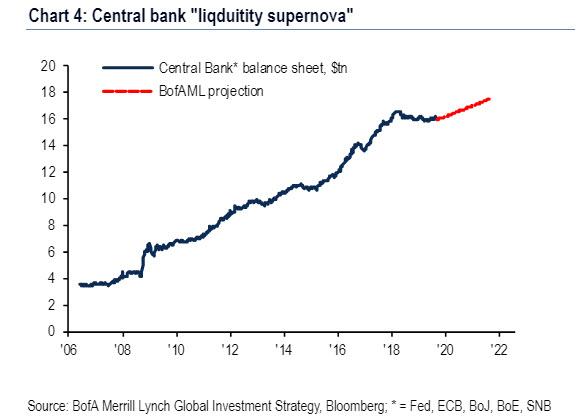
As we noted earlier today, as recently as Sept 3, global negative-yielding debt hit a record $17 trillion, the result of surging recession fears, while 40 global rate cuts in 2019 (China, ECB, Turkey, Malaysia this week) or a total of 748 since Lehman only made the bond bull case that much stronger; subsequently, the ECB’s “QE-infinity” announcement meant the “liquidity supernova” is back and central bank assets are back on course for new all-time high of $16.6 trillion in July’20, according to Bank of America, as shown in the chart below.
Of course, now that both Jackson Hole and Mario Draghi made it clear that monetary policy alone is impotent to stimulate growth, fiscal policy has entered the picture in a big way, with Mnuchin “seriously considering” issuance of 50-year Treasury, the UK announcing a 4.1% rise in government spending, Korea announcing a 9.8% increase, China likewise set to boost infrastructure spend by 7-9%, and even a recessionary Germany is set to raise spending €50bn.
Of course, as Draghi laid out on Thursday, the only way a fiscal stimulus deluge will be possible, is if central banks backstop the bond issuance with “open-ended QE”, de facto launching MMT-lite, which effectively means that the entire world is now set for “Japanification.”
The result, as BofA’s CIO Michael Hartnett explains, is that “investors are now all-in on bond bubble”:
this can be seen in record inflows to bonds + record prices across fixed income + widespread belief central banks to keep rates extraordinarily low + growing conviction US rates can turn negative = bond mania & 2019 consensus capitulation into “Japanification” theme; and explains 2019 extreme relative positioning in deflation assets vs. inflation assets, credit vs. gold, growth vs. value, defensives vs. cyclicals, US vs. RoW, passive vs. active, private equity vs. stocks…
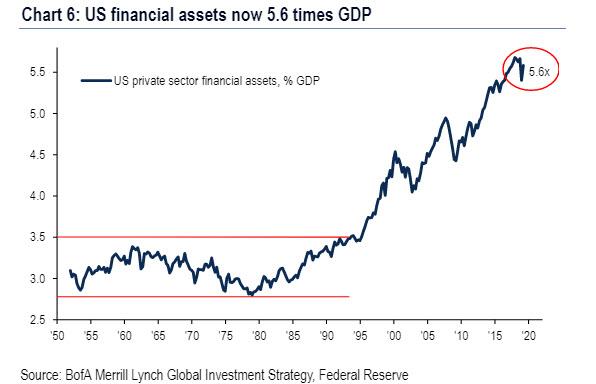
In an amusing tangent, Hartnett comes up with yet another name for central bankers: “Murders Row”, which he likens to the 1927 NY Yankees batting lineup (“those fellows not only beat you, they tear your heart out”) and says that in 2019 global policy makers are intent on reversing bearish Wall St sentiment… “since Wall St >5X size of Main St (Chart 6) they have every incentive to do so to reverse recession risk, contagion from manufacturing/trade.”
And so, with central banks on their way to remonetize (and nationalize) the world, there are clearly no signs of the bond bubble popping (why would there be with central banks set to backstop the bond market indefinitely): corporate bond inflows continue, private equity & venture capital on pace for record fundraising year ($624bn), QE restarting, zero contagion from Argentina credit event & Ford downgrade from IG to junk.
And yet, as first Morgan Stanley, and then SocGen noted, no-one is positioned for policy success, everyone is positioned for bond bubble to continue.
Which brings us to what BofA calls the “Most important chart in the world”, that of 10-year US Treasury yields, which for the 3rd time since 2012 have failed to sustain a break down below 1.5%…
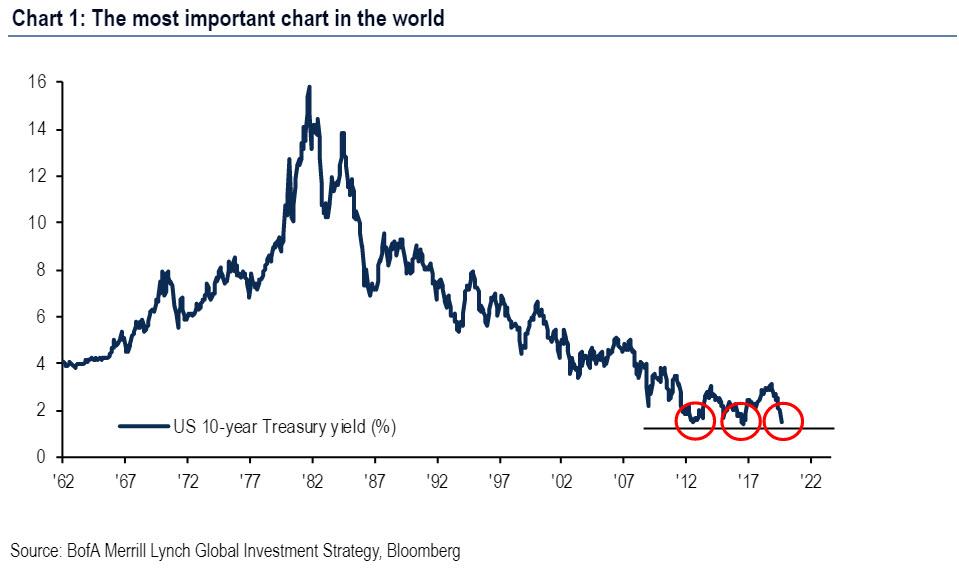
… in the process catalyzing a furious waterfall of downstream effects starting with yield retracement causing $2.4tn drop in negative-yielding bonds.

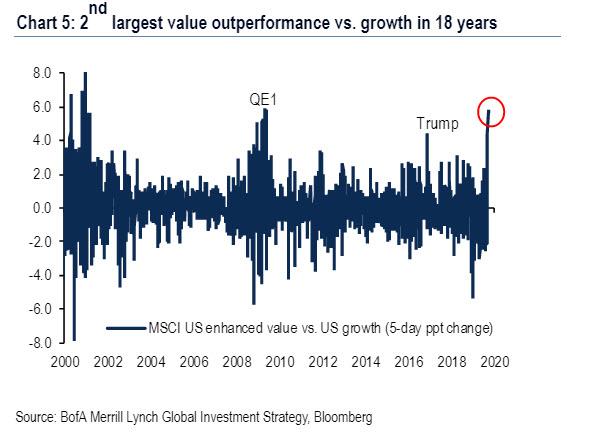
It was also this violent rejection of the 10Y breakdown that unleashed a historic quant quake, or as BofA calls it, the “hate rotation”, as the Value outperformed Growth by 6%t in 5 sessions, the 2nd largest relative return past 18 years.
The good news: for now there are – still – no sign of policy Impotence (US and European credit spreads back to new lows, BTP-bund spread just 138bps); bubbles pop but historically after surge in growth (e.g. Japan in ’89 = 4.9% GDP growth, US in ’99 = 4.8%, Eurozone in ’06 = 3.2%, China in ’07 = 14.2%); as such today’s bond bubble reduces risk of recession.
Meanwhile, the possibility of even more positive surprises has surged on the back of two key developments: huge bond Issuance (US corp. bond issuance to surge $130bn in Sept) allowing companies to refi into record low interest rates, as well as strong mortgage refis, which have resulted in an injection of cash into real economy, letting BofA conclude that macro can surprise to upside next 2 quarters.
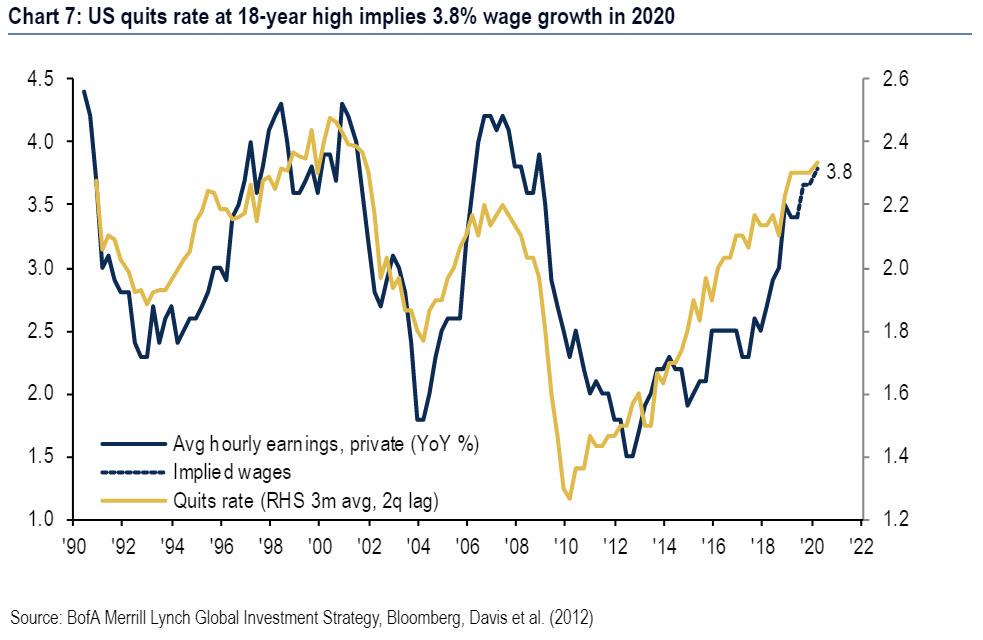
Yet the paradox is that much of this is happening in response to a certainty that the Fed will cut rates next week even as inflation is set to spike: to wit, the US quits ratio (workers quitting jobs = sign of confidence they find better job) hit an 18 year high of 2.4% in July – it leads private sector wages by two quarters and implies almost 4% wage growth in Q1’20
Meanwhile, rising investor interest in implications of a Warren/Sanders/Biden win in 2020 – all of which revolve around some version of helicopter money – also say inflation expectations are set to spike.
Based on these observations, here are Bank of America’s tactical conclusion:
- Bullish risk assets in 2019 as bearish investor sentiment & the irrationality of central banks and bond markets allows “overshoot” in credit & equity prices this autumn.
- No impotence, big issuance, rising inflation means recent violent growth to value, defensives to cyclicals continues episodically in coming months
However, BofA then turns bearish on risk assets in 2020 as the bond bubble pop induces a “Big Top” in credit (as spreads trough) & equities (as multiples peak), causing Wall St deleveraging and – at long last – Main St recession.
Tyler Durden
Fri, 09/13/2019 – 14:45
via ZeroHedge News https://ift.tt/2LtC7zY Tyler Durden