“How Can That Be?”: Corporate “Profits Puzzle” Leads To Striking Divergence
Submitted by Joseph G. Carson, Former Director of Global Economic Research, Alliance Bernstein
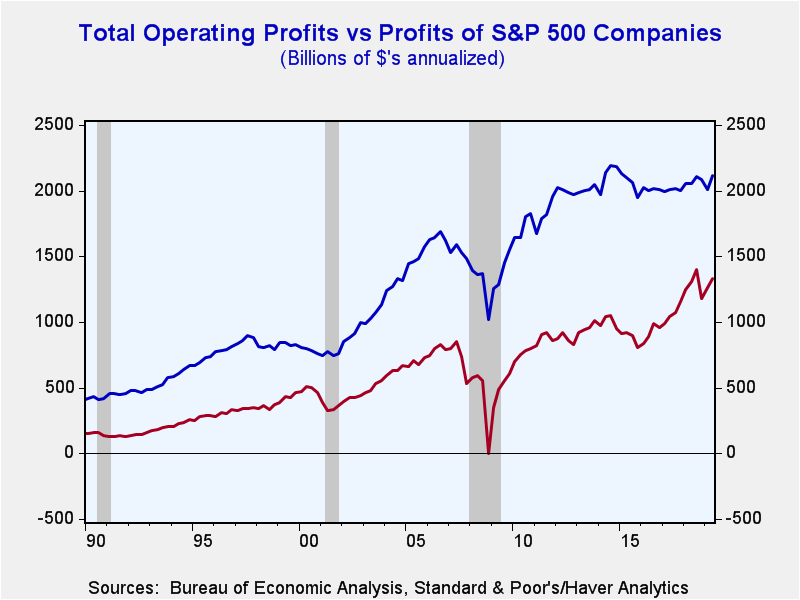
Operating profits for the overall economy have been essentially flat since 2014. Yet, during the same 5-year period operating profits for the S&P 500 companies are estimated to be up by a third.
Taken at face value, the profits data paints a picture of rising earnings for the companies that comprise the S&P 500 index while profits for millions of other firms are stagnant, if not contracting. How can that be? Are the earnings of S&P 500 companies “real” or are accounting gimmicks inflating them?
According to corporate profit data from the Bureau of Economic Analysis (BEA) operating profits for all US corporations (large and small and public and private) totaled $2.113 trillion in Q2 2019 essentially unchanged from the 2014 full year profit figure of $2.120 trillion.
Over the same 5-year period, the operating profits of S&P 500 companies have increased from $1.004 trillion in 2014 to an annualized estimated figure of $1.333 trillion in Q2 2019, and increase of 33%.
Both estimates of profits calculate earnings as the difference between receipts and expenses. Yet, the profit reports are based on two different accounting frameworks, financial and tax accounting.
Companies’ use financial accounting to report their results, while tax accounting results is the primary source for the GDP measure of profits. As a result, differences between the two profit measures can result from the timing of when receipts and expenses are recorded, as well of what is included and not included in receipts and expenses.
For example, the GDP gauge of operating profits adjusts for misreported and/or overstated measures of current income. Income or losses derived from capital sales are not part of the GDP measure of profits because they reflect the sale of existing assets and GDP is only measuring the profits from current production, and not the change in the valuation of items that were produced in previous periods.
Yet, S&P 500 profits, which are based on a financial accounting basis, do include income derived from capital sales, and other financial flows and adjustments as well.
At the currently reported levels for Q2 2019 S&P 500 profits amount to a record 63% of overall operating profits for all US companies. In the past 30 years there is only one other period when the share of S&P 500 earnings topped the 60% level. That occurred in the late 1990s when the large gain in reported S&P 500 profits was largely driven by capital gain income. And, during that period the GDP measure of operating profits followed a similar pattern to that of 2014 to 2019—flat to slightly down.
Corporate profits are an important measure of the economy’s overall performance as well as benchmark for the financial health of the corporate sector. The overall profit data raises questions about the general health of corporate sector. Moreover, the relative surge in S&P 500 earnings appears to be driven not by core operations and the experience of the late 1990s would argue that they unsustainable in their current form.
Tyler Durden
Wed, 09/25/2019 – 09:05
via ZeroHedge News https://ift.tt/2luMdGI Tyler Durden