How Likely Is A Repeat Of The Q4 2018 Market Crash? JPMorgan Answers
For the topic of his Sunday Start note, Morgan Stanley’s chief equity strategist Michael Wilson picked a compare and contrast – but mostly compare – to the prevailing conditions in the stock market exactly one year ago, when the S&P hit an all time high in late September only to careen into a Q4 bear market amid sharply higher yields and fears of overtightening, which forced the Fed to pull a sharp policy U-turn and shift from hawkish to dovish, and eventually cut rates while hinting at a restart of QE.
“As we head toward the end of the third quarter, I can’t help but think it feels very similar to last year in many ways” Wilson wrote, adding that “The S&P 500 is near its all-time high at 3000, while the MSCI EM Index and the Topix sit 20% and 15% below their highs and the Eurostoxx is 7% lower, leaving all these indices exactly where they traded a year ago. Growth stocks are still the most crowded part of equity managers’ portfolios – and the love affair may be stronger than ever at this point. But there are important differences too. Cyclical stocks have completely fallen out of bed and trade 20% lower than last September, while long-duration sovereign debt has been the best investment by far over this period, with 10-year Treasury yields 50% lower than just 12 months ago. To put this into context, over the past 50 years such a dramatic move in yields over the prior 12 months has only happened twice – during the global financial crisis in 2008 and the European sovereign debt crisis of 2011-12.”
While there was much more in Wilson’s note (see here), his conclusion was predictably ominous: “we’re moving from the perception that this is late-cycle to a belief that it’s end of cycle.”
In retrospect, the topic of Wilson’s note was not a coincidence, and as JPM’s Nick Panagirtzoglou wrote at roughly the same time in his own weekly periodicaly, Flows and Liquidity, “one question we are often asked by our clients is about the similarities and differences to last year”, now that “a year has passed since last year’s correction in risky markets such as equities and credit began into the fourth quarter of 2018.” Similar to Wilson, Panigirtzoglou asks “could last year’s correction be repeated into the fourth quarter of this year?” To answer this question, the JPM quant look at similarities and differences to last year across a range of macro, flow and position indicators.
So, without further ado, in terms of similarities to last year, JPMorgan – just like Morgan Stanley – sees several:
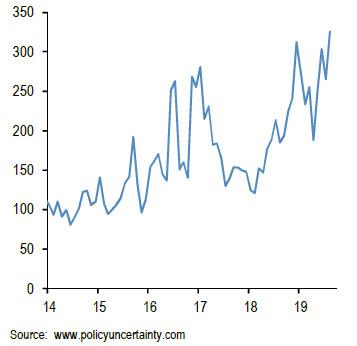
1) Continued weakness in global manufacturing and elevated uncertainty as trade war risks and concerns about late cycle dynamics in the US continue to hit business confidence. This is shown by Figure 1 which depicts a global uncertainty proxy constructed by Baker, Bloom and Davis (www.policyuncertainty.com). To a large extent, their proxy quantifies newspaper coverage of policy-related economic uncertainty as well as disagreement among economic forecasters. Not only does this uncertainty proxy remain elevated but its current level is even higher than that seen in September 2018.
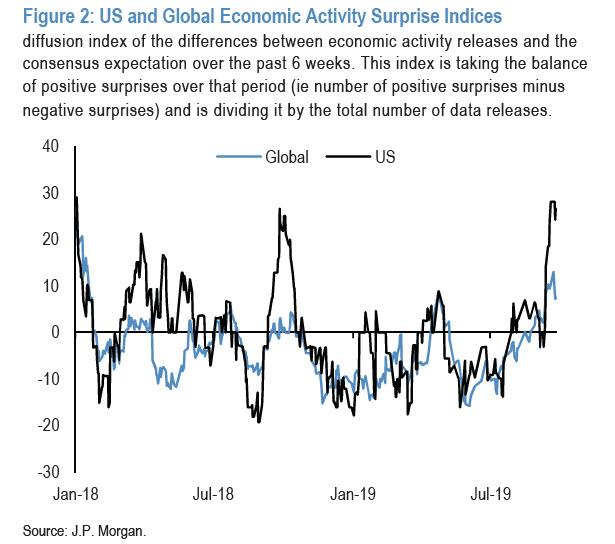
2) US economic growth outperformance relative to the rest of the world. This is shown by Figure 2 which depicts JPM’s Economic Activity Surprise Index (EASI) for the US. This index captures the difference between US economic activity releases and the consensus expectation over a six-week rolling window. The level of the index stands at pretty high levels at the moment, very similar to the highs seen a year ago in September 2018, suggesting that US economic activity indicators have been surprising consensus expectations predominantly positively over the past weeks. But similar to last year, the very high level currently creates the risk of mean reversion, i.e. the risk that US economic activity surprises turn less positive into year end.
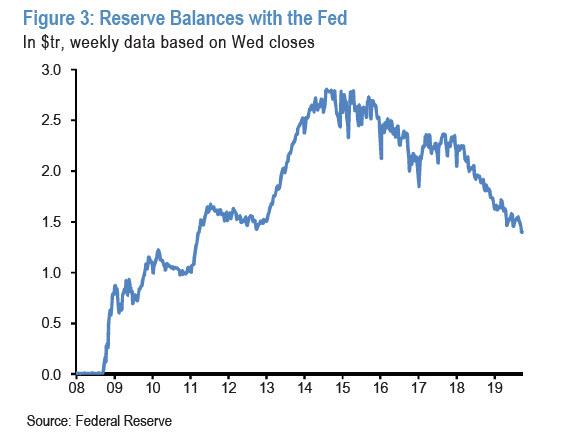
3) A strong dollar helped not only by US economic growth outperformance by also a shortage of dollar cash. This shortage is reflected by the reserves balance at the Fed. This reserves balance remains low at close to $1.4tr despite the temporary injections of liquidity via overnight and 14-day operations by the Fed. In particular, the temporary $105bn injection of liquidity via the Fed’s repo operations in the two weeks from Sep 11th to Sep 25th has only partially offset the increases in the Treasury’s General Account, with reserves declining from $1459bn to $1427bn (Figure 3). This tightening, along with the relative macro surprises, has likely helped to push the dollar higher over the past two weeks.
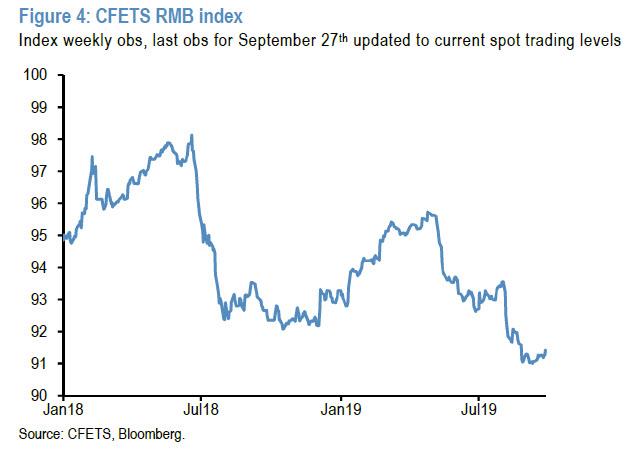
4) While China has delivered stimulus through a number of channels to mitigate the impact of the trade conflict, it has also exported some of slowdown to the rest of the world via currency depreciation. The depreciation seen in the Chinese currency over the summer months is similar in magnitude to the depreciation seen in the summer of 2018 preceding the Q4 2018 risky market correction. This is shown in Figure 4 via the CFETS trade-weighted index for the Chinese renminbi as produced by the People’s Bank of China. This trade-weighted index was introduced at the end of 2015 in an attempt by the central bank to discourage investors from exclusively focusing on the yuan’s fluctuations against the dollar. The CFETS index lost close to 5% since the end of April, similar in magnitude to the 6% correction seen between June and September 2018.
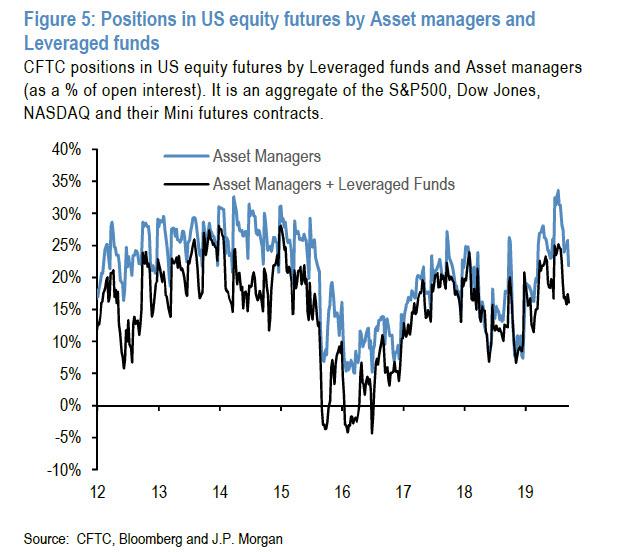
5) US equity futures positions by Asset Managers and Leveraged funds are as high as they were in September 2018 leaving equities vulnerable. This is shown by Figure 5.
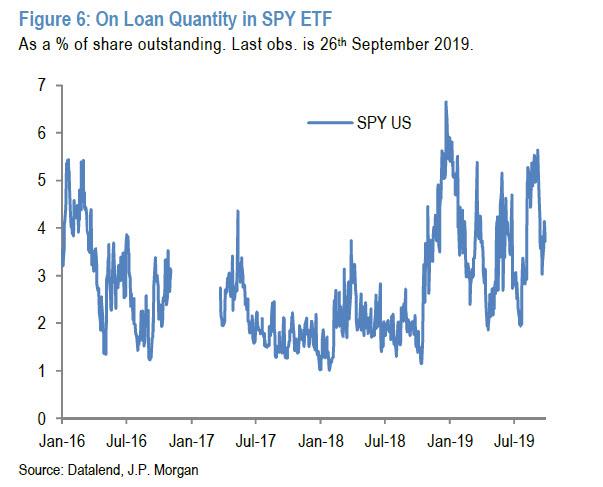
6) JPM’s short interest proxy for the SPY US Equity ETF, the biggest equity ETF in the world and a popular vehicle to express short positions by institutional investors, is currently far from very high or capitulation levels, as it was the case in September 2018 (Figure 6). But Figure 6 shows that there is also a difference. Relative to September 2018, the current level of this short interest proxy is more elevated than its level seen in September 2018 suggesting that there is currently a higher short base in US equities than the one existing in September 2018, even if this metric is far from the capitulation levels of December 2018.
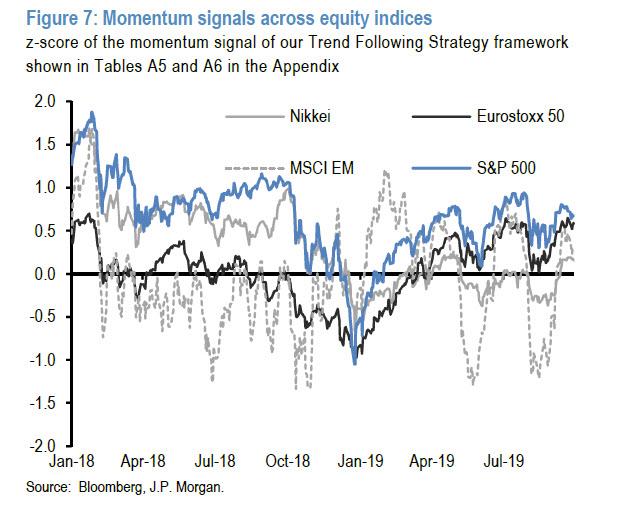
7) Momentum traders such as CTAs are long equities enough to amplify a potential down move in equities as they did in Q4 2018. JPM’s momentum signal for US equity futures is not as high as it was in September 2018, when the z-score stood at 1.0 stdev (Figure 7). But at 0.5 stdevs currently this momentum signal is still positive enough to amplify any potential downmove triggered by other types of equity investors as in Q4 2018. Figure 7 shows that at the time the momentum signal for the S&P500 index swung from +1 stdev in September to -1 stdev by December. A similar 2 stdevs swing could happen in the current conjuncture.
* * *
That said, there are also differences between then and now.
One key difference with September 2018 is that trend-following investors such as CTAs are long equities across all regions while in September 2018 they were long in US and Japanese equities but neutralish in European and EM equities. At the time, this had helped EM and European equities to outperform US equities during the Q4 2018 correction. This time such differentiation across regions looks less likely if an equity correction takes place into the end of the year.
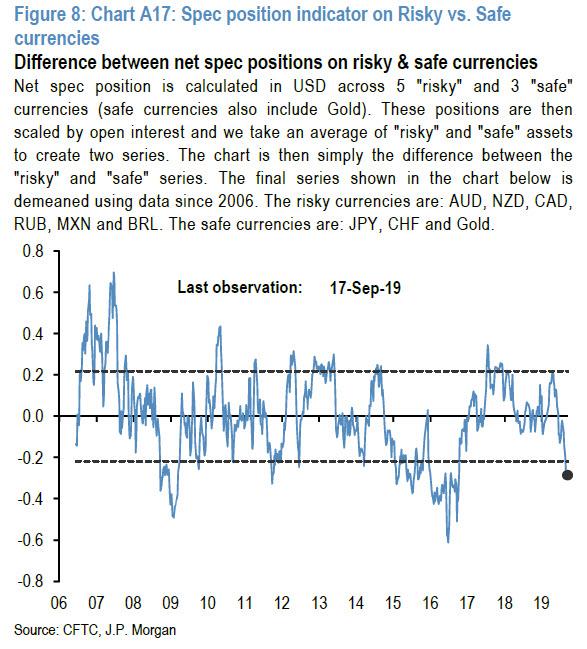
What about other differences beyond the two differences mentioned above in sections 6) and 7)? One other difference is in the currency space. Figure 8 shows that risky currencies such as EM and commodity currencies look oversold relative to safe currencies, i.e. JPY, CHF and Gold. This implies that any downside in risky currencies and any upside in safe currencies would be more limited this time relative to the experience of Q4 2018.
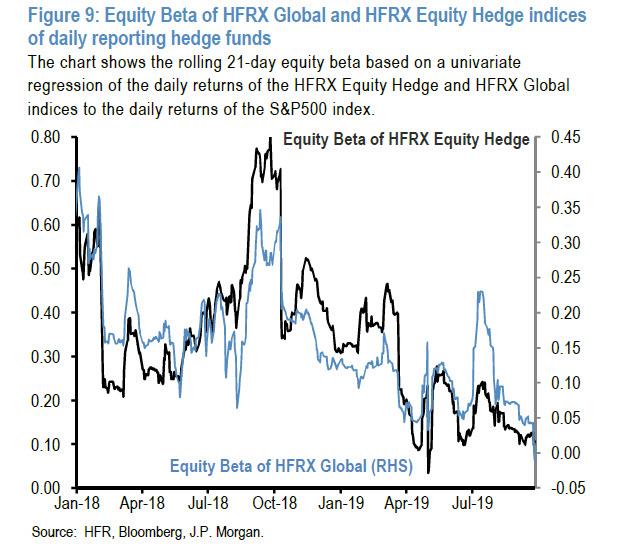
Another apparent difference to last year is the equity exposure of daily reporting hedge funds. This is shown by Figure 9 which depicts the 21-day rolling equity beta of HFRX Global Hedge Fund index. At face value, this suggests that hedge funds are pretty underinvested in equities relative to a pretty overweight positions in September 2018. But there are two problems with this interpretation.
The first problem is that the HFRX Global Hedge Fund index of daily reporting hedge funds is less global than is often perceived and is dominated by daily reporting Equity Long/Short hedge funds. Indeed, Figure 9 shows that the equity betas of the HFRX Global and HFRX Equity Long/Short hedge fund indices have exhibited very similar patterns over the past years. Therefore, the JPM quant believes that the picture in Figure 9 is more representative of Equity Long/Short hedge funds rather than the overall hedge fund universe.
A second problem is that, as mentioned in our previous reports, this year there has been significant divergence between the HFRX index of daily reporting Equity Long/Short hedge funds and the HFRI index of monthly reporting Equity Long/Short hedge funds. The daily reporting Equity Long/Short hedge funds exhibited low equity betas for most of the year as shown in Figure 9. However, the much bigger in terms of AUM universe of monthly reporting Equity Long/Short hedge funds is sending a different message. By delivering a loss of 1.6% in August vs. a loss of 2.5% for the MSCI AC World index, these monthly reporting Equity Long/Short hedge funds exhibited in August a beta of above the historical average of 0.5. In other words, their most recent performance for August implies an above average rather than below average equity exposure casting doubt to the message implied by Figure 9.
But there is no doubt that the most important difference to last year is that central banks are now easing policy via both rate cuts and quantitative measures rather than tightening which was the case during 2018. And this is an important difference as it suggests that central banks are supporting equity and credit investor sentiment rather than acting as a headwind. This supportive central bank policy also means that bond yields are much lower today that they were a year ago making investors more OW fixed income and thus less OW equities than they were last year.
This is shown by Figure 10, Figure 11 and Figure 12 which show the implied bond, equity and cash allocations of non-bank investors globally. Figure 10 implies that investors are currently very OW bonds, the most OW since the beginning of 2016, a big contrast to the very UW bond position they held in September last year. There are two implications from this big bond OW. The first implication is that investors are less OW equities currently than in September 2z018 (Figure 11). The second implication is that investors are the most UW cash they have been since 2007 (Figure 12), suggesting that at the aggregate level there is little cash sitting on the sidelines.

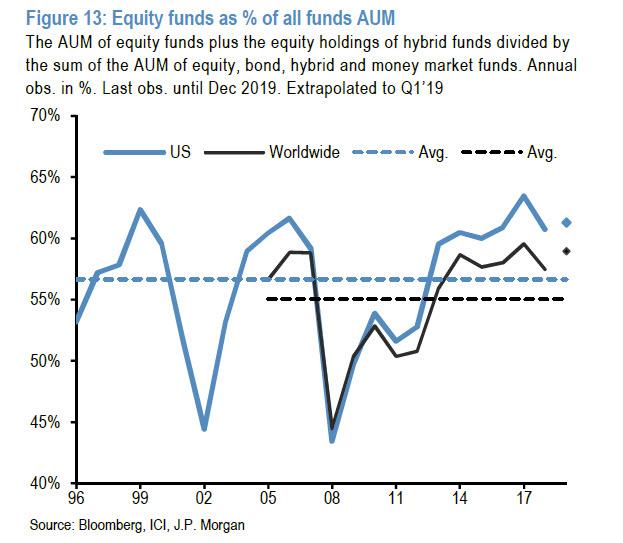
But the picture above faces challenges: although lower that in September 2014, the current implied equity allocation of investors globally is still pretty high relative to the post Lehman history. This is especially true for retail investors which at 60%, their equity fund share globally is not far from previous record highs (Figure 13). This big equity OW explains why retail investors have been heavy sellers of equity funds and heavy buyers of bond funds this year, as they struggled to prevent their equity OWs from rising too much due to the 15% rally in global equities.
Finally, and perhaps most controversially is Panigirtzoglou’s assertion that “the idea that central bank policy will prevent an equity correction faces challenges also.” As he further explains, if central banks’ rather reluctant easing disappoints demanding market expectations going forward, “there is a risk that investors begin to cover their cash UWs depressing both equity and bond prices.” And then there is the nuclear scenario: if investors’ concerns over the marginal efficacy of further central bank stimulus in the absence of any significant fiscal stimulus grow from here, particularly in the face of further escalation in trade conflicts, central bank easing may fail to bolster investors’ confidence that a more serious cyclical downturn can be prevented. Also, central bank easing may turn out to be too little too late to if the dynamics of a more serious cyclical downturn or recession are already taking hold: “After all, economic variables alone continue to point to persistently high probability of a US recession at close to 45%, higher than it ever got in 2016 both in terms of magnitude and persistence”, the JPM quant ominously writes.
In conclusion, while the JPMorgan strategist acknowledges that at the moment investors equity exposures are overall lower than in September 2018, “they are not low enough to prevent an equity correction from happening.” And while central banks are easing this year relative to the tightening they inflicted in 2018, “the idea that central banks easing can prevent an equity correction form taking place is facing several key, and increasingly growing challenges.”
Tyler Durden
Mon, 09/30/2019 – 14:00
via ZeroHedge News https://ift.tt/2n0EH7d Tyler Durden