Platts: 4 Commodity Charts To Watch This Week
Via S&P Global Platts Insight blog,
As LME week kicks off, S&P Global Platts editors take a closer look at the current drivers of copper prices. US oil and refined products trade, UK political parties’ energy policies, and a glut of Russian coal on the European market round out this week’s selection.
1. Upturn in copper prices a key talking point for LME Week
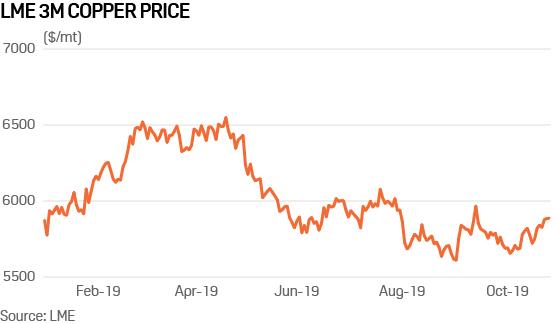
What’s happening? 2019 has proved a turbulent year for metals, with the continued trade dispute between the US and China – and the associated economic malaise – one of the biggest drivers. For copper it has been a kick in the teeth, as the metal dropped from around $6,600/mt in April to a low of $5,520/mt in September, although it is currently trading somewhat higher at around $5,895/mt. As LME Week begins, there is renewed optimism for copper prices headed into 2020. The recent pick-up has been prompted by talk of a possible partial trade resolution, and strikes in major producing nation Chile, part of a wave of protests over rising living costs and high levels of inequality in the country.
What’s next? Citi bank expects copper to rebound. Max Layton, an analyst at the bank, is placing bullish bets on the metal in 2020. “We forecast $6,500/mt by H2 2020, targeting $6,300/mt on a 6-month view, on the back of sustained supply disruptions and an anticipated rebound in macroeconomic sentiment,” Layton said. Others see a more moderate adjustment. S&P Global Market Intelligence commodities analyst Tom Rutland expects prices to stay similar to 2019 levels, averaging around the $6,000/t mark. “In 2020, we estimate that global copper demand will grow at similar levels to refined production, maintaining a balanced market,” he said.
2. US headed for net petroleum exports through 2020
What’s happening? As US shale production continues to grow and petroleum exports climb, the country has become a net total petroleum exporter this month, the latest figures from the US Energy Information Administration show. The US was a net exporter of 621,000 b/d of total petroleum the week ending October 18. That followed two weeks of net exports to the tune of roughly 30,000 b/d. The recent shift has also been driven by a sharp 438,000 b/d decline in crude imports to 5.86 million b/d the week ending October 18.
What’s next? Crude imports are likely to rise again, as the 438,000 b/d decline in the third week of October could have been the result of loading delays related to Tropical Storm Nestor. US Census data shows imports, particularly from Mexico, rising following the storm. Also, a combined 2.2 million b/d of distillation capacity is currently down for maintenance in the Midwest and USGC, according to S&P Global Platts Analytics, but most of this will be back online by end-November, which would imply higher crude imports. Still, the longer term trend is for the US to be a net exporter of total petroleum through 2020, according to the EIA, although this will be driven primarily by a rise in refined products and other liquid fuels exports. The EIA’s Short-Term Energy Outlook shows the US as a net exporter of 1.53 million b/d by December 2020, while remaining a net importer of crude.
3. Energy policy in spotlight as UK general election looms
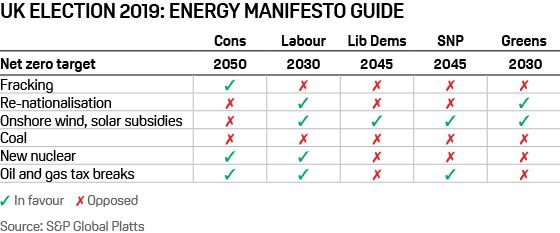
What’s happening? The UK’s opposition Labour Party has set out a radical low-carbon energy plan ahead of a possible general election. Some 30 recommendations, put together by a team of independent experts, urge an immediate, vast expansion of offshore and onshore wind and solar, and all new buildings to be net zero carbon from 2020.
What’s next? Distinct differences between the UK’s various political parties on climate and energy policy will come in to focus if/when General Election manifestos are published. One key area of uncertainty is Labour’s position on oil and gas tax breaks. It has to square the circle of supporting jobs and investment with its decarbonisation strategy. Our assumption is Labour’s focus will be on raising corporation tax rather than removing E&P tax breaks.
4. Russian thermal coal floods European market
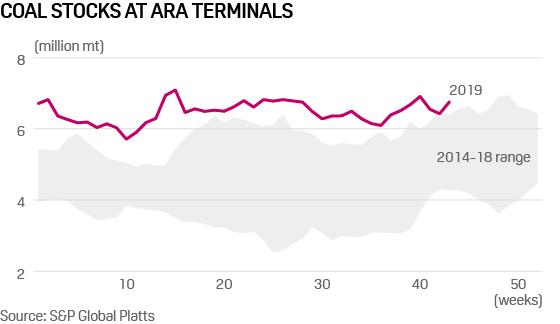
What’s happening? The European coal market is being inundated with Russian thermal coal, keeping stockpiles at Dutch terminals close to record highs and more than one million mt above the five-year average. This is reducing spot demand as the winter season gets underway, and placing firm downward pressure on CIF ARA coal prices, which have struggled to hold above the $60/mt level for the last six months.
What’s next? Russian coal exports show little sign of significantly reducing, which will likely see ARA stocks remain close to 7 million mt over winter. A strong winter coal burn could alleviate the pressure, but this seems unlikely given recent competitive natural gas prices, which have so far left coal out of the money in Europe. This has kept price expectations for the first half of 2020 similarly bleak to the low pricing environment which has defined 2019 so far, and the multi-years low of $45/mt may soon be tested.
Tyler Durden
Mon, 10/28/2019 – 14:32
via ZeroHedge News https://ift.tt/2MX0VkF Tyler Durden