Demographics & Money Creation… Why Fed Monetization Is Just Getting Warmed-Up
Authored by Chris Hamilton via Econimica blog,
Today, the annual issuance of Treasury debt crossed the $1 trillion mark for the 2019 calendar year (crossing $23 trillion with two months still to go). Below, surging public (marketable) debt, slowing intragovernmental (Social Security and other trust funds) deb, versus the Federal Funds Rate (cost of short term money).
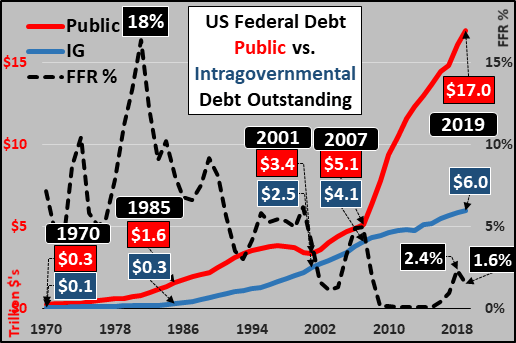
The fact that all that Treasury issuance has come in the last three months should be noteworthy, but heck, the Treasury had some catching up to do after another debt ceiling impasse!?! Still, over the same period, the Federal Reserve has cut interest rates by 35%. Over that same period, the Fed has ceased QT, pivoted, and initiated some of the most aggressive QE we have yet seen. This has increased the Fed’s balance sheet over $260 billion in just over two months, since the Fed’s pivot of late August. Over the same period, the Fed has engaged in the most aggressive monetization of debt (decreasing bank held excess reserves against increasing Fed assets) we have seen since the depths of 2009?!? Suffice it to say, these are not signs of strength or confidence but instead signs of panic. But why???
But before I answer that, this is also a big day for me and my blog. My blog, Econimica, is about to pass 1 million reads (and my articles re-posted gratis elsewhere thanks to ZeroHedge, DollarCollapse, GoldSilver, Ricefarmer, 321Gold, TheSoundingline, TheAutomaticEarth, etc. have long passed 10 million reads). Glamorous as the life of a blogger is, I can’t say if the reason I only make $2 per article on my blog is because I drink too much or if my drinking is a coping mechanism for only making $2 an article?!? All I can say is I create content that answers my own questions and these sites seem to appreciate this (for FREE). I have nothing to sell, make no suggestion for purchases, and offer no advice. I simply provide the data and hope able minded persons will come to their own conclusions. But on this momentous occasion, I thought I’d take the uncharacteristically sober opportunity to suggest what is happening and why.
For hundreds or even thousands of years, the study of demographics (statistical data relating to the population and groups within it) was a sleepy backwater somewhat akin to watching the grass grow. So much so that economists no longer bothered themselves with the minutiae involved. Economists built models (assuming demographics would forever remain static) on the idea that if ever more capital was freed, more supply would be created, and rising demand would consume ever more.
However, at this point in time, the changing demographics are everything. If you don’t understand the demographics, you really don’t understand what is happening and why previous economic theories no longer make sense.
To put it simply, certain populations (wealthier) and certain age groups (wealthier working age adults) do the vast majority of consuming and undertake the vast majority of new loans (debt) which pushes the quantity of “money” and consumer demand ever higher. But today I detail that growth (where it counts) is at an end among the populations and age groups that drive demand. The net result is the end of rising consumption, rising credit, and the rising growth in “money”.
In our fractional reserve system, something like 10% of deposits are held back and the remaining 90% are loaned out. Thus, the vast majority of “money” is lent into existence via banks as customers take out new loans or credit. But again, not all customers are alike, as it is wealthier young adults and middle aged adults that undertake the bulk of new loans for homes, cars, education, etc. Conversely, elderly are generally credit averse and far more likely to pay down or pay off existing loans than to undertake new loans. This makes sense since the labor force participation rate among elderly (70+ year-olds) is about 10%, in comparison to labor force participation rates of 80%+ among 25 to 54 year-olds. So, elderly live on fixed incomes and generally live within their means. That isn’t to say that credit isn’t on the rise among the elderly, just nowhere near the levels it is utilized by the working age population (20 to 70 year-olds).
Global Picture
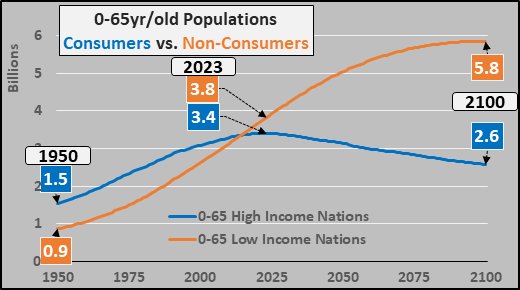
On a global basis, the chart below splits the global under 65 year-old population in half. In blue, the under 65 population of nations that make above $4,000 annually per capita (or on average above $16,000 per capita) and those making less the $4,000 (or those averaging below $1,600 per capita annually). Noteworthy is despite the large inflow of immigrants from poor nations, the global consumer population under 65 years-old will begin declining by 2023 and decline indefinitely thereafter. All population growth from there on will be among the under 65 year-old non-consumers (or poor nations) and as the next chart below shows, among the non-credit wielding wealthy and poor elderly.
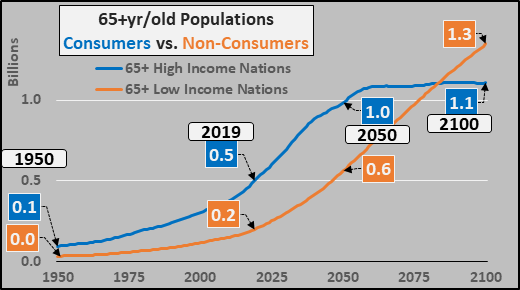
Below, decelerating over 65 year-old population growth through 2050 before the wealthy elderly cease growing, leaving only the poor elderly to rise alone through 2100.
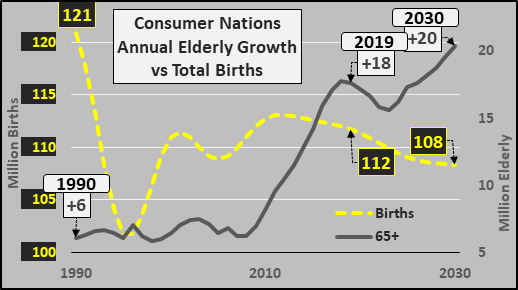
Or a single chart to detail the situation (below). Despite an influx of immigration, the total births in the wealthier half of the world have declined over 7.5% since 1990 (yellow dashed line) versus the tripling of annual growth among the wealthier nations combined 65+ year-old population. Simply put, nothing like this has happened in the last ten thousand years…and nothing like this is likely again for the next ten thousand. Aka, “the demographic moment”, the “inflexion point”, or the moment where “shit hits the wall”.
Shifting to the US
According to the Fed’s Survey of Consumer Finances HERE, 75+ year-olds are half as likely to utilize credit as the working age population, and among the half of 75+ year-olds with debt, they have less than half as much debt as the middle aged. Translated, 75+ year-olds create less than 25% the credit than that of the working age population.
So, what happens to credit creation (and growth of the money supply) when population growth slows and shifts to those least likely to undertake new loans or credit? Que the Treasury, Federal Reserve, Congress-critters, + Trump.
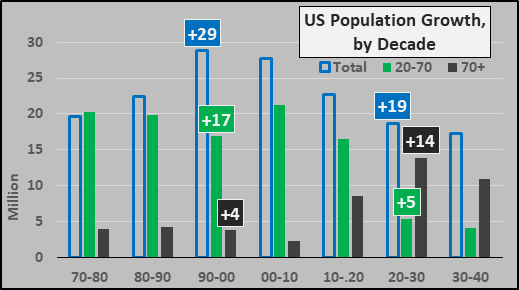
Below, US population growth in the upcoming decade will be far slower than previous decades. On a decade over decade basis, US population growth will be almost 35% slower than during peak growth seen from 1990 to 2000 (or growing about 10 million fewer than peak growth). Second, growth will shift from the working age population (20 to 70 year-olds) to the 70+ year-olds (the non-working population).
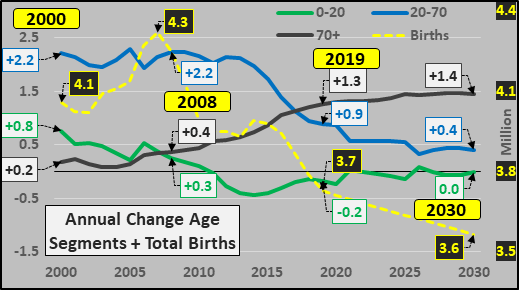
Looking at the annual population growth of the US, by age segments, plus total annual births, below. The large deceleration of growth among the working age population is plain (blue line) and the tripling of annual growth of the 70+ year-olds isn’t hard to pick out (grey line). The 14% decline in births since the ’07 peak is also noteworthy (yellow dashed line).
From 2020 through 2030, total population growth slows 20%, and 75% of what population growth remains is among 70+ year-olds…total reversal from previous decades.
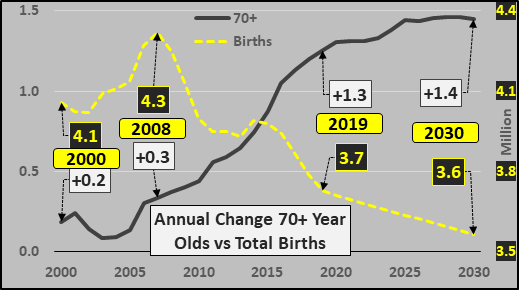
Below, looking specifically at the opposite ends of the spectrum. Tanking births (yellow dashed line) versus huge growth among the elderly population (grey line), also known as an inverting pyramid…BTW, this is not a structure known for its stability (LOL)!
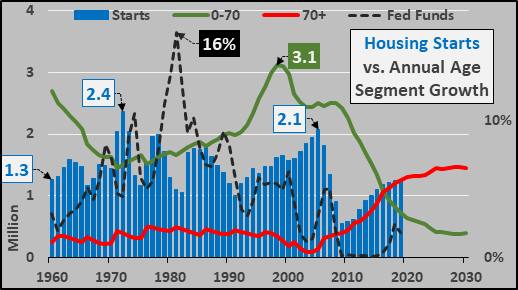
Below, looking at housing starts (blue columns), federal funds rate (black dashed line), and the annual growth of the 0 to 70 year-old (green line) versus 70+ year-old (red line) populations. The issue is minimal growth among the working age (coupled with full employment among this population) versus a deleveraging elderly population. An economy primarily driven by new housing and all that orbits new housing (infrastructure, factories, manufacturing, durable goods, etc.) is set to endure little to no organic demand growth (but of course the US federal government and the Fed can follow the Japanese or Chinese models to continue creating “bridges to nowhere” and “ghost cities” to perpetuate the inevitable).
What does this mean? This should mean that the growth of the money supply lags significantly or doesn’t grow at all. The population that typically utilizes credit is growing minimally and the population that sparsely uses credit (or net pays off debt) is growing rapidly in the US and among consumer nations. The natural outcome would not be asset inflation and bull markets…at least not organically.
But in a system where the growth of credit (“money”) is necessary simply to pay the interest, only if we look behind the veil could we see how this “bull market” is being made.
To follow through on my point of aged based credit creation, I’ll utilize the 2016 (most recent) Federal Reserve Survey of Consumer Finances (HERE), detailing the changing situation from 1989 through 2016. It is laid out juxtaposing age groups; young adults (under 35 year-olds) prime adults (45-54 year-olds) and elderly (75+ year-olds).
Utilization of Debt (Any)
First, the percentage of families utilizing debt has been consistent aside for the increased reliance among the elderly.

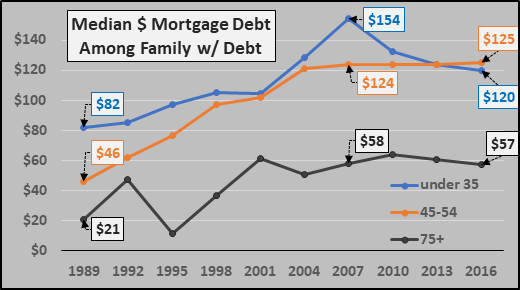
Mortgage Debt
Next, the percentage of families with mortgage debt has been declining for young and prime aged adults since 2007 while the reverse has been true among the elderly (below). However, still less than one quarter of 75+ year-olds have outstanding mortgage debt versus over half of prime aged adults.

Since 2007, median mortgage debt among those families carrying mortgages (percentages above) has decreased among the young, remained flat among the prime aged adults and elderly (below). But again, less than half the number of elderly carry mortgage debt, and those that do carry less than half of the working age or young adult populations.
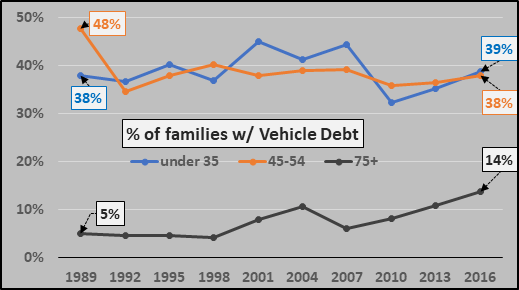
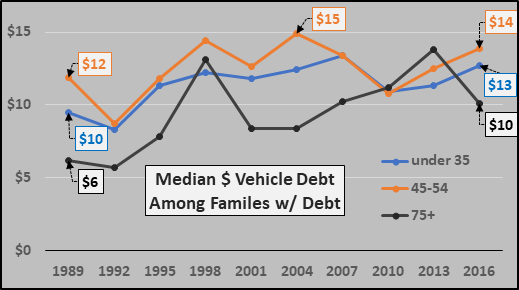
Vehicle Debt
The percentage of families with vehicle debt is fairly consistent among young and prime aged adults, less than half among elderly despite gently rising.
Fairly consistent median vehicle debt among families with debt and fairly consistent accross age groups.
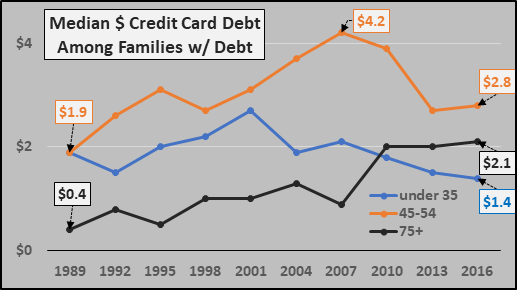
Credit Card Debt
Below, the percentage of families w/ credit car debt, by age groups. Elderly are almost half as likely to have outstanding credit card debt.

Below, median credit card debt is declining amid all segments except the elderly.
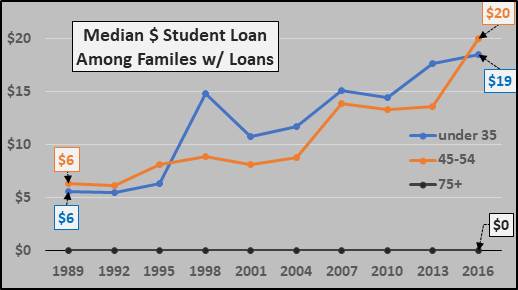
Student Loan Debt
The percentage of young adults and prime aged adults carrying student loan debt continues to crank upward (below). Of course, the percentage of 75+ year-olds with student loan debt is essentially zero. Or said otherwise, the primary vehicle for credit creation (money growth) is entirely avoided by the population that is set to experience all the growth for the next two decades!?!

Below, rising median student loan debt among students and their parents that carry student loans. As for the only population that is set to grow in abundance over the next two decades, the elderly…not so much.
Conclusion:
The very negative organic demographic outcome of a serious review of credit creation and money growth should be plain. But this is where so many have gone terribly wrong and lost gobs of money…in a centrally controlled world, bad is good! The “badder” the underlying fundamentals, the “gooder” the synthetically driven growth!!! The worse the organic situation, the more the poor are hammered and the wealthy made wealthier. The weaker the potential growth of demand, the stronger the rationale for the Fed, central banks, and federal governments to delay the inevitable. And when I say delay the inevitable, I (nor the Fed or like actors) know if this is a year, a decade, or ??? It is simply an all-in bet with nothing to cover the eventual, inevitable losses.
All population data is via UN World Population Prospects 2019.
Tyler Durden
Sat, 11/02/2019 – 13:30
via ZeroHedge News https://ift.tt/324nMyU Tyler Durden