Goldman: Most Investors Are Focusing On Elizabeth Warren’s Rising Election Prospects
When it comes to the main Democratic contender for the 2020 presidential election, now that we have learned that Joe Biden’s campaign is going through a very difficult time, opinions about Elizabeth Warren and her impact on the market range from one extreme to the other. On the one hand we have:
- Does Elizabeth Warren Want To Crash The Global Financial Markets?
- Tudor Jones, Steve Cohen Warn Of Market Collapse If Warren Elected
- Cooperman: If Warren Wins They Won’t Open The Stock Market
- Fleckenstein: Market Would Be “Limit Down” If Elizabeth Warren Was Elected Today
- Elizabeth Warren Blames Businesses For Everything
- Billionaire Cooperman Blasts Warren For “Sh*tting On The Fu**ing American Dream”
On the other, we recently noted that “An Elizabeth Warren Presidency May Not Be Catastrophic For The Market” while the most famous behind the scenes democratic operative, George Soros, recently effectively endorsed Warren:
And then there’s this, which makes a mockery of anyone predicting the fate of capital markets based on who is president:
With that in mind, and considering that the 2020 election is now just 366 days away, Goldman’s chief equity strategist David Kostin writes that portfolio managers are intently focused on the investment implications of potential outcomes of the 2020 US elections, and specifically on Elizabeth Warren’s rising prospects in both the prediction markets and polls.
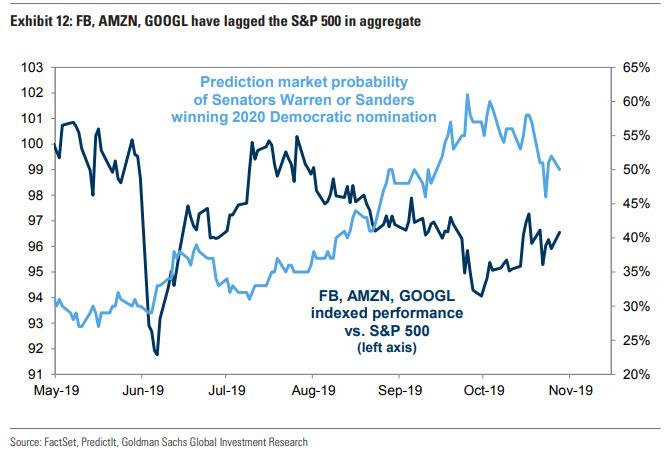
What is odd is that while Senator Warren is the clear favorite in prediction markets…
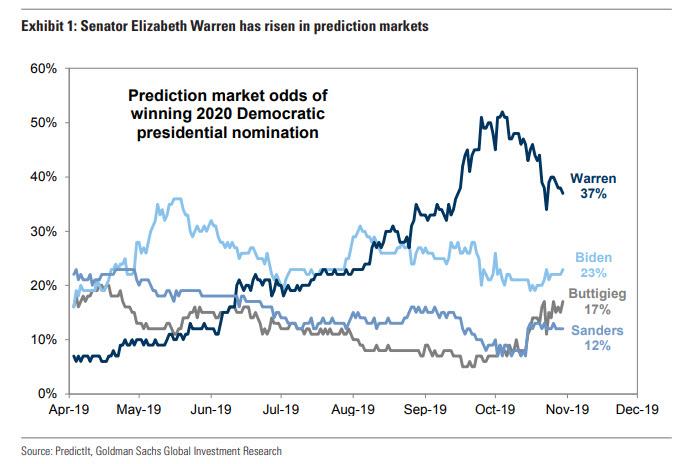
… polls still show Joe Biden as the leader, even if Warren is fast approaching (although in the aftermath of the absolute disaster for pollsters that was the 2016 presidential election, we are shocked anyone still pays attention to what polls – which have now been outed as a political ploy meant to suppress voting intentions – represent).

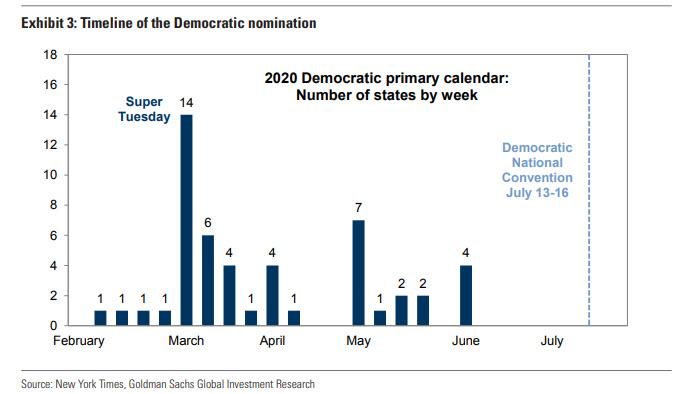
The good news is that confusion will rapidly drop after Super Tuesday when the field of candidates for the Democratic nomination will narrow significantly. The first nomination contest, the Iowa caucus, takes place on February 3rd, roughly 100 days from now. Voters in 18 states will have cast their ballots by March 3rd. Approximately 34% of total delegates are slated to be pledged on March 3rd alone (“Super Tuesday”), when 14 states will hold primaries.
Yet election uncertainty is expected to remain high even after the Democratic nominee is officially determined at the July 13-16th party convention (plus there is always the Hillary Clinton wildcard): as Goldman notes, “the US is politically divided and the general election for the Presidency and many Congressional races are extremely competitive. Prediction markets assign a 74% probability that Democrats maintain control of the House of Representatives and a 54% likelihood the party captures the Presidency.
And while occupancy of the White House is important, investors also need to focus attention on which party controls the Senate. Here, prediction markets assign just a 35% likelihood that the Democrats will gain control of the Senate.
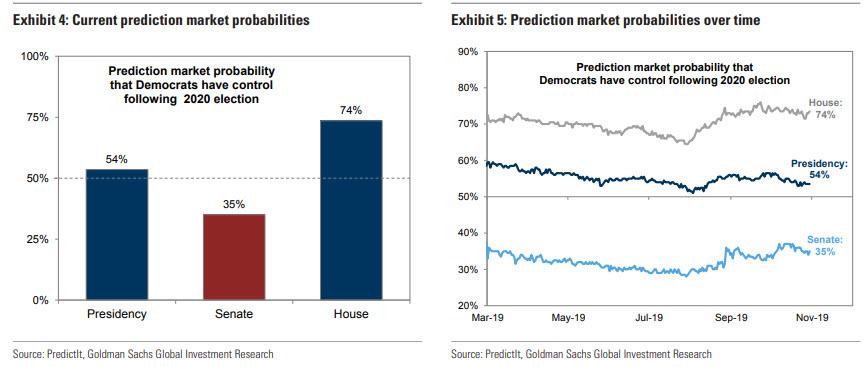
According to Kostin, “taken together, prediction markets currently suggest a roughly 70% likelihood that the 2020 election results in a divided government. Prediction markets assign a 20% probability of a Democratic sweep and a 10% probability of a Republican sweep.” As a result, “a divided Congress would likely constrain the prospect of sweeping legislation or reforms, which require passage from both chambers of Congress.“
So what do these odds imply for markets? To answer this question, Goldman looks at two key aspects of markets: earnings and valuations.
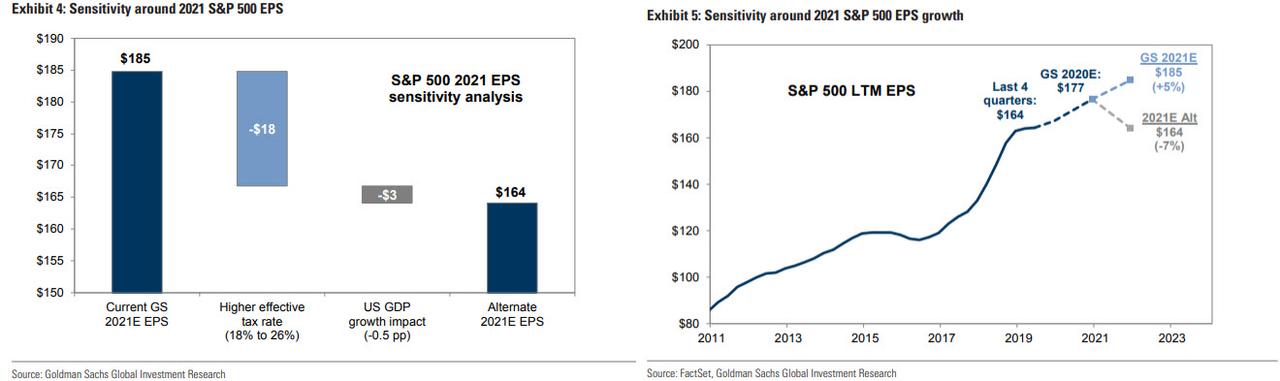
From an earnings perspective, it is well-known that several presidential candidates have proposed rolling back the 2017 corporate tax cut. Democratic presidential candidates including Senator Warren, Senator Sanders, Mayor Buttigieg, and former Vice President Biden have called for higher corporate tax rates. Here, the rule of thumb is that every 1% increase in effective tax rate translates into a roughly 1% decrease in S&P 500 EPS.
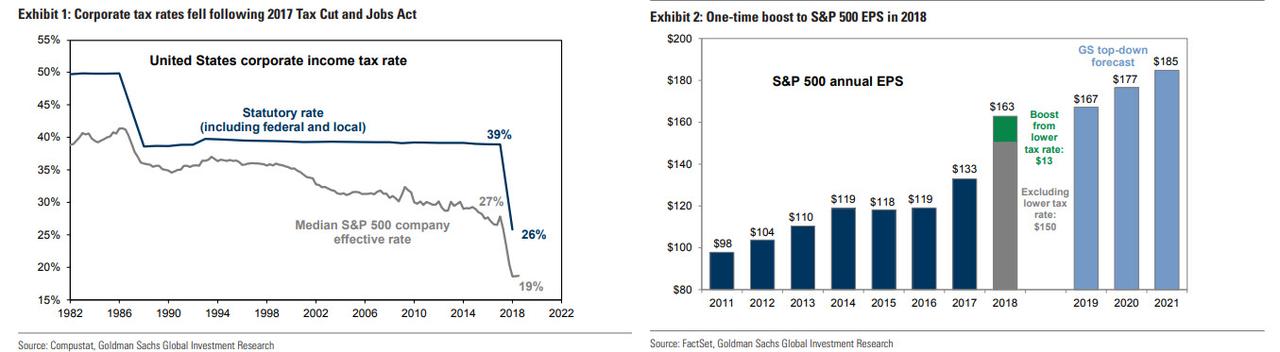
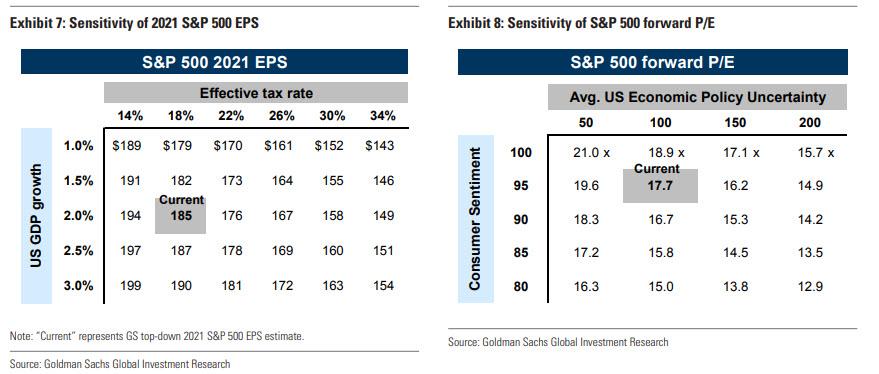
Increasing the effective tax rate by 8% from 18% back to 26% would reduce Goldman’s 2021 S&P 500 EPS estimate by $21 (11%) to $164, assuming the legislation applies retroactively to the start of 2021. $18 of the reduction comes directly from a higher tax rate and $3 comes from a reversal of the estimated impact of corporate tax reform on US GDP growth in 2018.
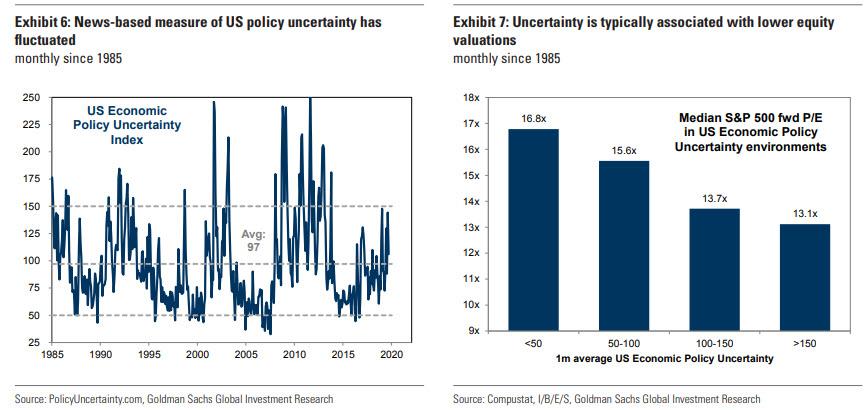
From a valuation perspective, Goldman cautions that changes in policy uncertainty and consumer confidence will impact valuations ahead of the 2020 election. Uncertainty is already elevated; indeed, the Global Economic Policy Uncertainty Index is near record highs and the US index averaged 105 this year (vs. the long-term average of 97). Goldman uses its macro model of the yield gap between the S&P 500 earnings yield and 10-year US Treasury yield to estimate the impact of uncertainty and confidence on equity valuations, and observes that if policy uncertainty rises by 50 points, the yield gap would increase and lead to a P/E compression of 1-2 multiple points from the current level of 18x; if consumer confidence falls by 10 points (from 96 to 85), S&P 500 P/E would decline by roughly 2 multiple points, all else equal.
That said, the best course of action may be to do nothing. After all, prediction markets imply just a 20% probability of Democratic sweep and a 10% likelihood of a Republican sweep. As such, Kostin suggests that “investors should discount the likelihood that policies can actually be adopted” and adds that “based on our earnings and valuation sensitivities, the current state of the race implies a probability-weighted year-end 2020 S&P 500 level of roughly 3200. In addition, recent history has shown that US equities react more to policy implementation than election outcomes.”
Yet even if Goldman believes complacency may be the best alternative, and the S&P500 which just hit a new all time high of 3,063 agrees, the Goldman strategist does point out that investors have started to use options to protect positions broadly from election uncertainty even as volatility typically rises sharply just one month prior to the Election Day. Of note, the term structure of implied volatility vol curve shows elevated levels around November 2020, reflecting uncertainty around the election outcome.
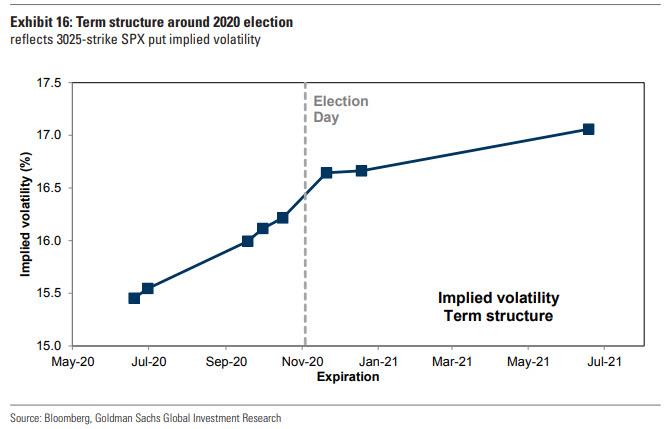
Here Kostin also notes that the bank’s previous research shows that equity index implied volatility tends to rise most immediately ahead of political events. For example, implied volatility rose sharply ahead of the Brexit referendum in 2016, the US election in 2016, and the French election in 2017, but only within the two to three weeks ahead of those events. In other words, the market will most likely freak out just days before a potential Warren presidency is actually in the cards.
There is more.
While Goldman cautions that both health care and bank stocks will likely be dramatically affected by a Warren presidency, it is the “Big Tech” sector – who stocks have broadly underperformed since July – that is most at risk, due to a confluence of risk factors.
Consider that both Democrats and Republicans have called for regulatory and antitrust scrutiny of “Big Tech” companies. The rhetoric has been centered primarily on FB, AMZN, and GOOGL, and this summer the Department of Justice (DoJ), the Federal Trade Commission (FTC), and many state attorneys-general have launched investigations into the companies. These stocks have lagged in aggregate during the past three months, but it may not all be attributable to policy overhang; August brought a sharp rotation out of growth stocks and into value stocks as trade news improved and recession fears eased.
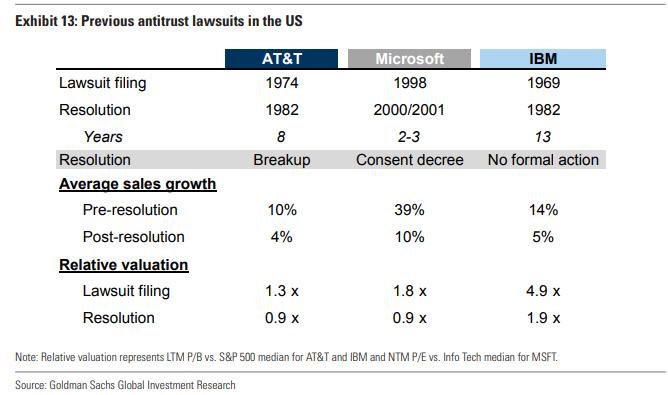
Indeed, while Goldman remains “Overweight” the Information Technology sector (22% of the S&P 500), it is downgrading the Communication Services to Neutral from Overweight on the basis of rising regulatory risk. The bank cites its previous research which showed that antitrust lawsuits typically take years to resolve but ultimately result in lower valuation between lawsuit filing and resolution and slower sales growth following resolution. And although Goldman sees the growth prospects of many Communication Services companies as still attractive, the valuation overhang from regulatory uncertainty will likely continue to grow and weigh on the sector’s performance. The sector represents 10% of the S&P 500 with FB (17%) and GOOGL (29%) the dominant constituents accounting for 46% of the sector’s market cap.
What does history show
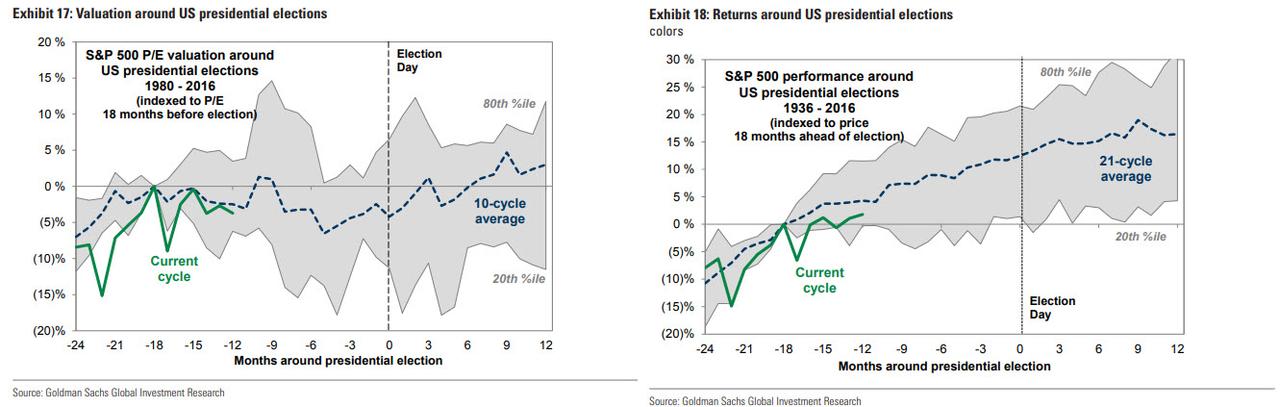
While it is the case that US market performance has usually been positive during the 12 months before an election (see chart below), returns have been driven by earnings rather than valuation. In fact, valuations typically moved sideways during the lead-up to presidential elections before moving higher following Election Day, as the overhang from uncertainty faded. Despite flat valuations, positive earnings growth typically powered positive equity returns. Since 1936, the S&P 500 annual return during a presidential election year equaled 10%. It is worth noting that with the S&P now set for its third consecutive quarter of declining earnings, it is not clear just what catalyst will serve as the inflection point to push corporate profitability higher, which would suggest that 2020 may be an outlier to this general trend.
As Kostin writes separately, history suggests that US equities actually react more to policy implementation than election outcomes. When considering the earnings and valuation scenarios discussed above, investors must also account for the fact that several conditions must be met for these policies to impact equity prices: (1) a particular candidate must win the presidency, (2) the candidate’s party must control the House and the Senate, (3) the candidate must choose to pursue certain policies, and (4) the legislation must pass through Congress. These scenarios must therefore be discounted by the probability that these conditions are all met.
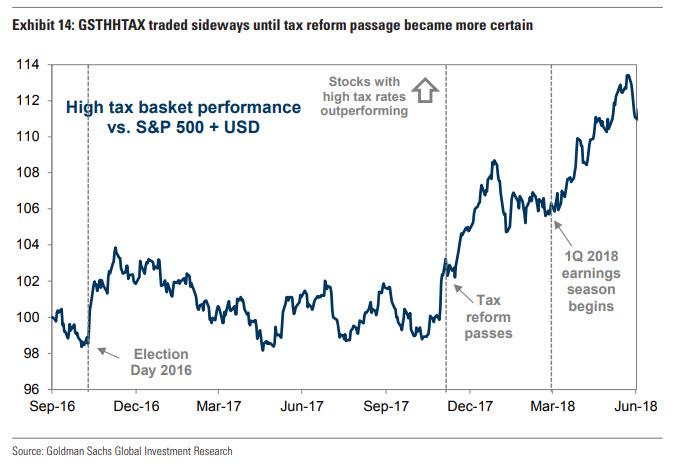
The 2016 example demonstrates the importance of policy implementation. In the month following the 2016 election, many “Trump Trades” – such as cyclicals, small-caps, and infrastructure beneficiaries – sharply outperformed. However, these trades reversed their gains during the subsequent year as investors reduced expectations of immediate policy implementation. The performance of Goldman’s sector-neutral high tax rate basket (ticker: GSTHHTAX) around tax reform provides a clear example. Following the initial rally and unwind in early 2017, investors adopted a “show-me” attitude towards tax reform given congressional hurdles. Constituents of GSTHHTAX, which stood to gain the most from lower corporate tax rates, traded sideways up until passage of the legislation became clear.
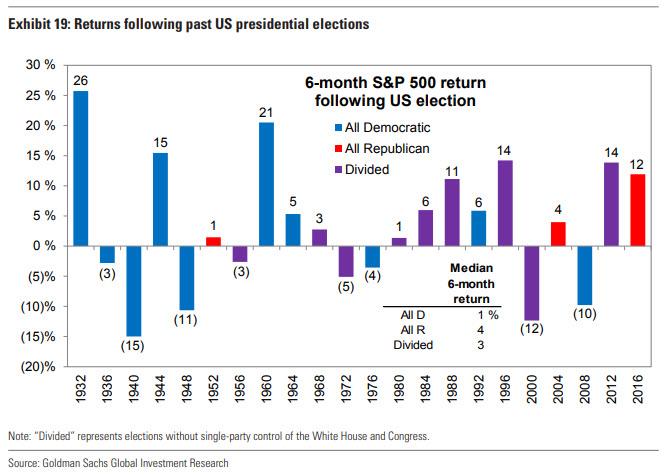
What about after the election
The last chart below provides 6-month returns for the S&P 500 following past elections, stratified by outcome. Since 1932, the median S&P 500 return for an all-Democratic sweep equals +1%, compared with +4% for an all-Republican sweep and +3% for a divided government.
Tyler Durden
Sat, 11/02/2019 – 15:54
via ZeroHedge News https://ift.tt/36wsA3I Tyler Durden