Bank Of America: Stocks Are The Most Expensive Since The Jan 2018 Meltup “But There Is No Alternative”
Despite today’s modest dip, the S&P closed Friday at a new all time high just shy of 3,100, just as Q3 earnings posted their first Y/Y decline since 2016 largely due to a 36% plunge in energy company earnings…
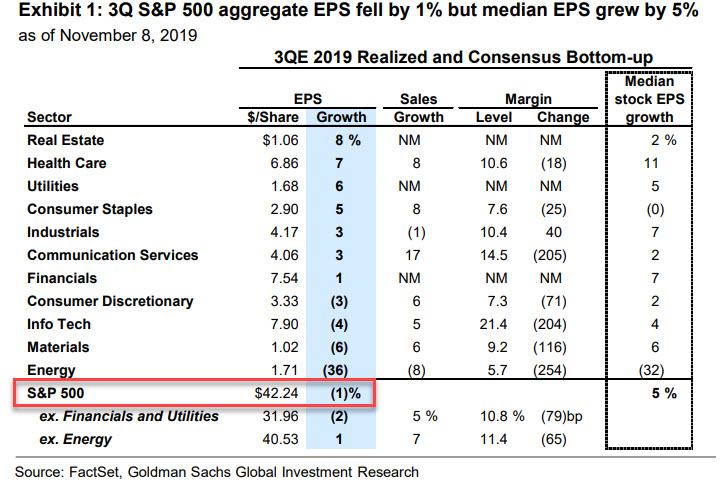
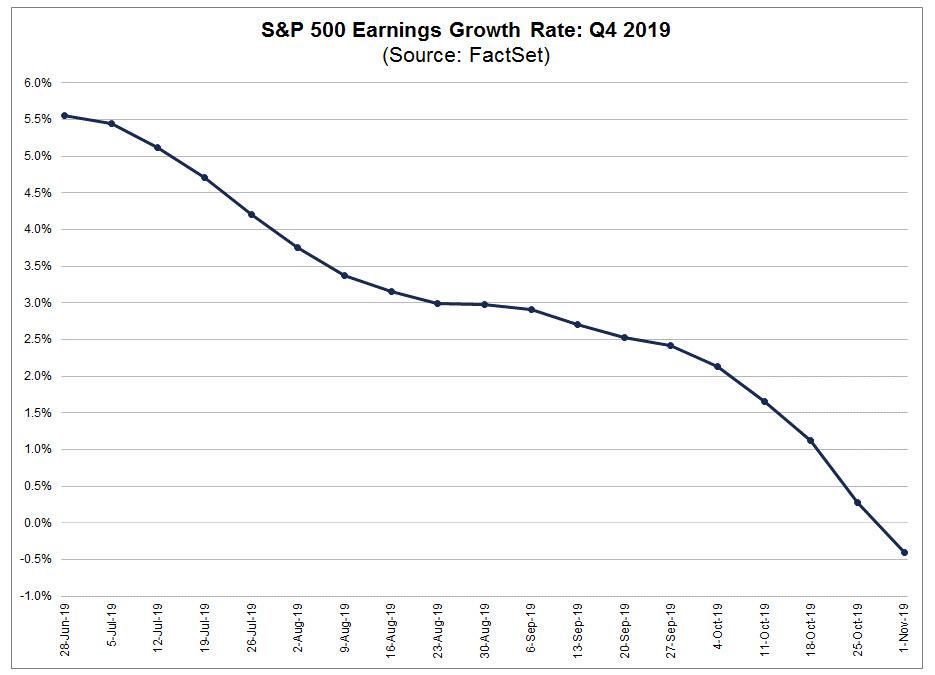
… having broken out to new highs since Oct 28th, led by a continued rotation into more cyclical/value stocks. Meanwhile, it’s not just Q3, but also Q4 earnings that are now expected to post a decline, with consensus expecting a -0.5% drop in EPS next quarter according to Factset.
At a sector level, Industrials and Financials have led since the breakout, both up over 3% in eight trading days heading into last Friday vs. the S&P’s 2% gain, on the back of a continuation of the Value rotation we discussed previously – mostly as a result of sharply higher Treasury yields – and which JPMorgan believes will only escalate from here on the back of even higher yields (Marko Kolanovic is confident the 10Y yield can rise another 150 bps before hitting equity markets) given recent stabilization in macro data and what Bank of America has found is a record discount Value stocks currently offer vs. Momentum stocks.
Some more observations on this from BofA, which agrees with JPM that the recent rotation into Value/out of Momentum could continue:
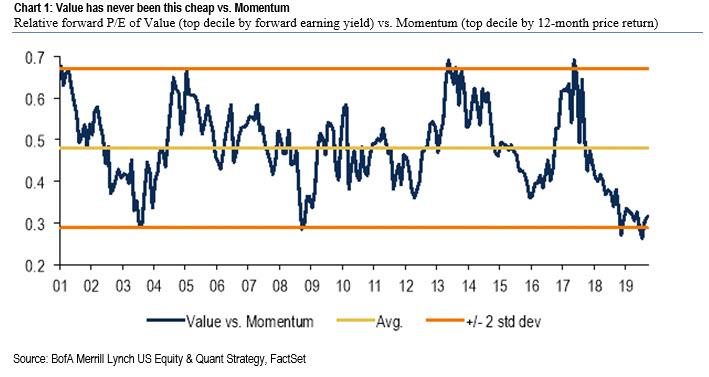
The “Downturn” phase in our US Regime Indicator has historically lasted eight months on average (we’re now in month eight). The next phase is “Early Cycle,” when Value typically outperforms. Some recent signs of stabilization in macro data also supports that the downturn might be bottoming and the Value rotation could continue. Value also has never been this cheap vs. Momentum (Chart 1), with the relative forward P/E of Value vs. Momentum at two standard deviations below the average. The only time in history that Value has gotten this cheap was in 2003 and 2008, when Value outperformed Momentum by 22ppt and 69ppt, respectively, over the subsequent 12 months.
Putting it all together, the forward P/E ratio for the S&P rose 2% to 17.4x in October according to Factset, the highest level since January 2018, while forward EPS estimates fell 0.3% on downward revisions during this earnings season.
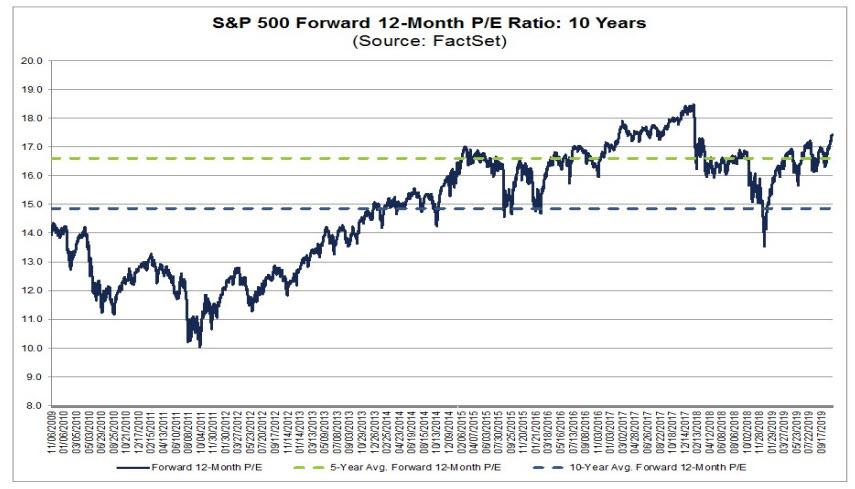
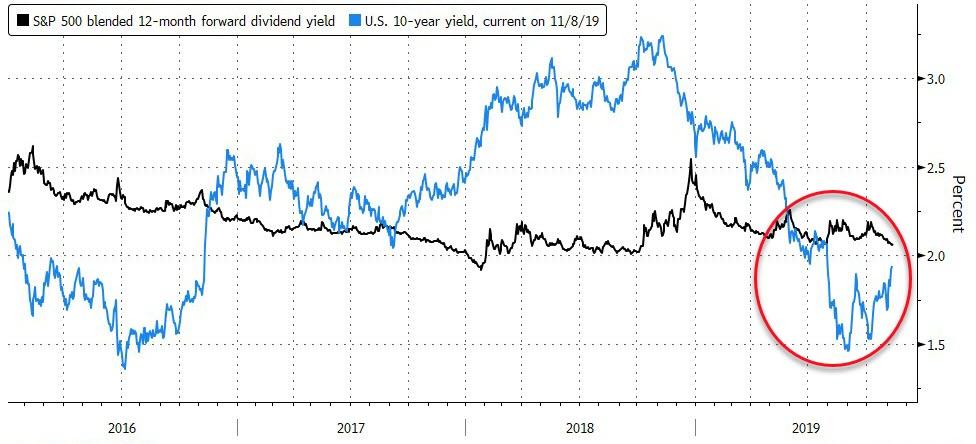
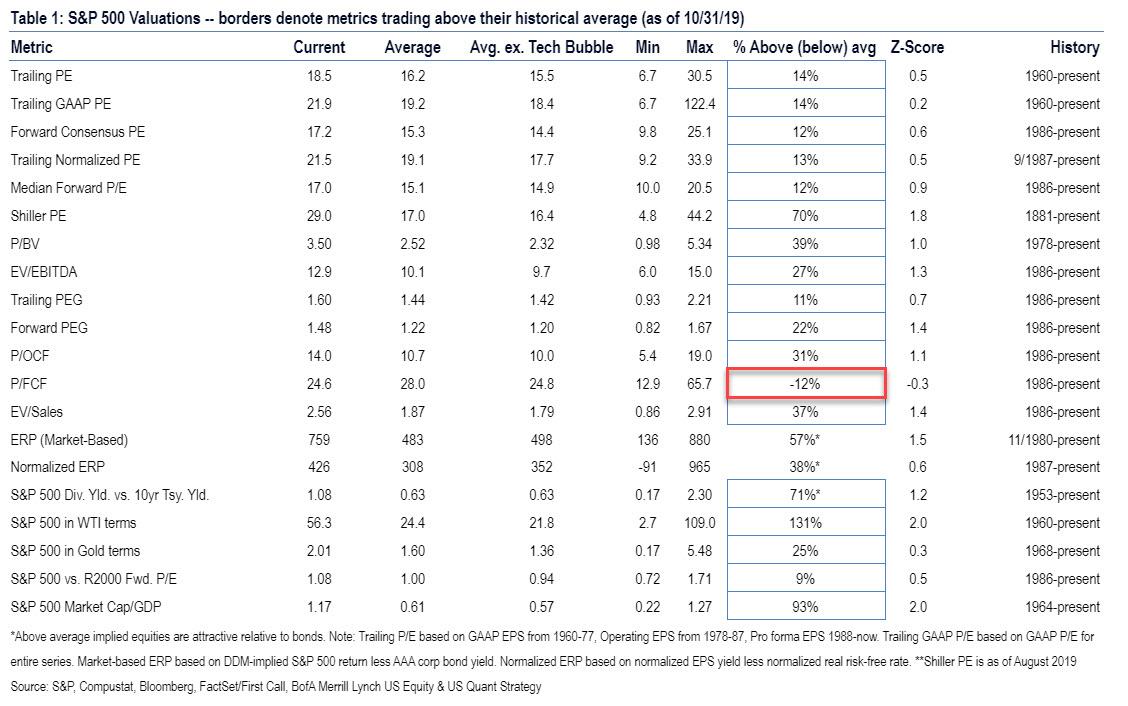
The bottom line, according to Bank of America is that “stocks look expensive on earnings, but there is no alternative (TINA), with the S&P 500 yielding similar to the 10-year Treasury yield.“
Indeed, as BofA shows in its own S&P “cheap or expensive” relative modfel, the the broader stock market is now cheap on just one metric: Price to Free Cash Flow.
What happens then? According to Goldman’s David Kostin, looking into 2020 consensus expectations for 9% EPS growth
appear too optimistic, although as the Goldmanite points out, “consensus estimates are usually too optimistic. Consensus 2020 earnings estimates have come down by 4% since March 2019 and the current trajectory of revisions is consistent with the historical pattern”.
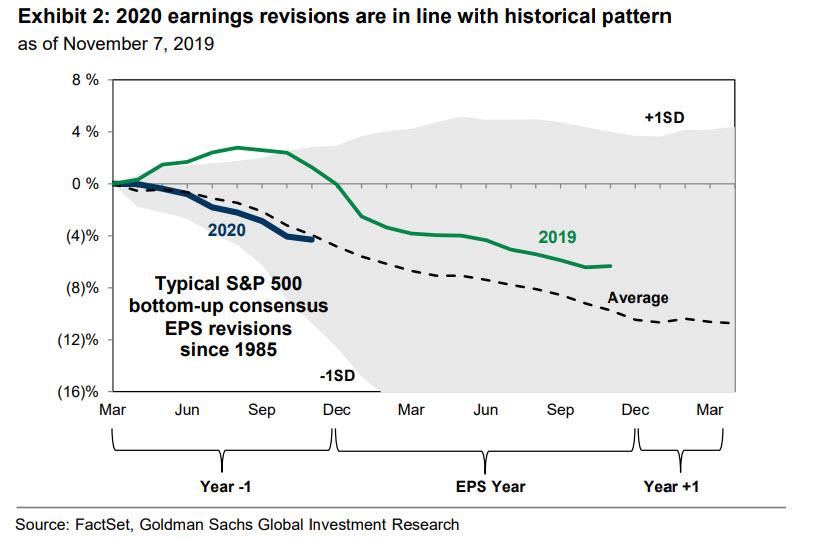
Meanwhile, Goldman’s own topdown 2020 EPS growth estimate of 6% implies just some modest negative revisions, roughly in line with this pattern.
In short, nobody expects a recession either this year, or next.
Tyler Durden
Mon, 11/11/2019 – 18:05
via ZeroHedge News https://ift.tt/2Q6TIAo Tyler Durden