What’s Behind The Relentless Market Melt-Up: Dealers Choking On “Gamma” As Meltup Becomes Reason For Meltup
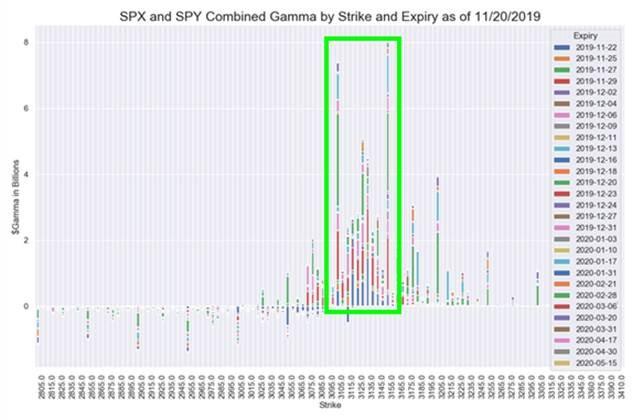
A few days ago we showed how a gamma-gravity “castle” has been erected by dealers at the 3,100 and 3,150 strikes, where total notional for SPX and SPY strikes had reached a whopping $8 billion, making it virtually impossible for stocks to escape this 50 points “gravitational” range.
Now, in a testament to the reflexive nature of markets, where trader intentions often direct market outcomes, Nomura’s quant Charlie McElligott shows how the recent surge in equity gamma has created a feedback loop in which rising stock prices force dealers to load up on more risk, forcing stocks to risk more, and so on.
As McElligott notes, with the S&P grinding higher, it has become “the perfect virtuous feedback loop for the market to choke on sustained “Long Gamma,” as customers sell Vol to Dealer desks largely via yield enhancement strategies” which in turn feels like a perpetual marketwide “pin” positioned between the abovementioned gamma strikes of 3100 and 3150.
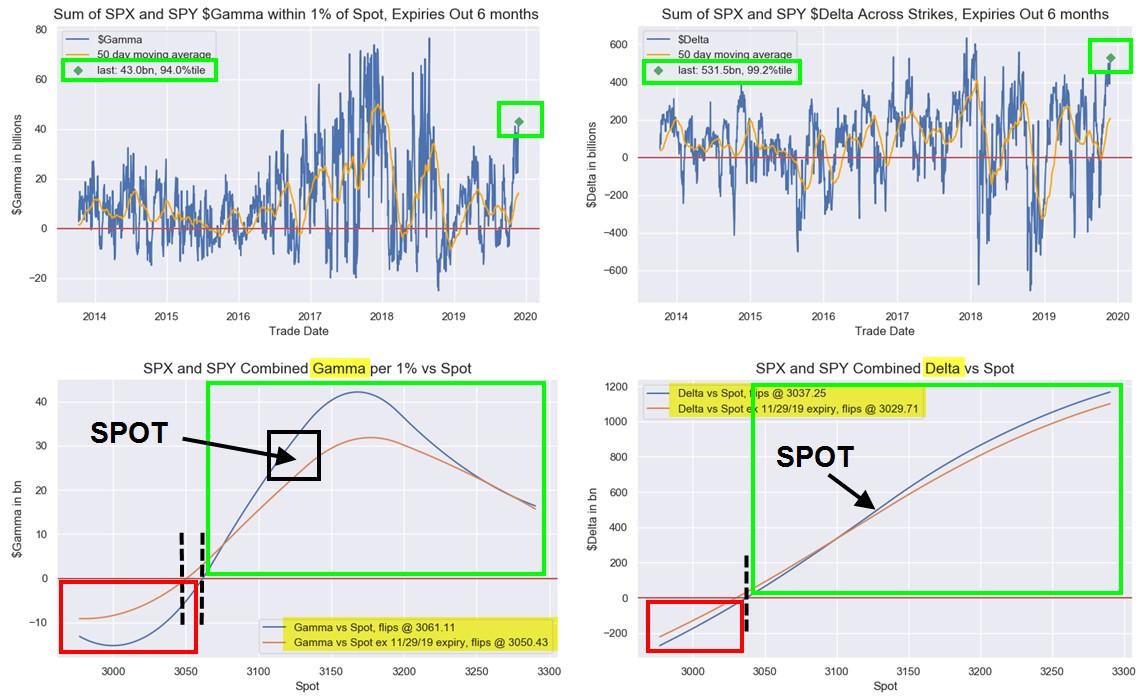
The resulting “extreme” SPX gamma, which has reached the 94th percentile and Delta, at 99th %Ile, continues to spark the levitation in the markets and the “feel good” stasis for stocks, particularly as such massive Dealer “Long Gamma” squelches intraday volatility due to hedging flows selling strength and buying weakness, which in turn means spot vol crumbles and provides yet another feedback loop to push risk even higher.
For a visual representation of the above, McElligott shows why this extreme dealer “long gamma” matters: as follows:
- 1) intraday movement is squelched by dealers selling strength and buying dips (thus negligible ‘hi / low’ 1d range),
- 2) subsequently creating flows which insulate the market against large drawdowns (note: %’s are ‘positive,’ but are inverted axis for formatting purposes with Python)

Further supporting the bullish technical case, the current underlying positioning snapshot shows that the dealer “Long Gamma” position would not flip “Short” until all the way down in the 3050-3060 range (where a move below would subsequently allow us to “release” and MOVE), while the Delta position would flip down close to 3020-3030.
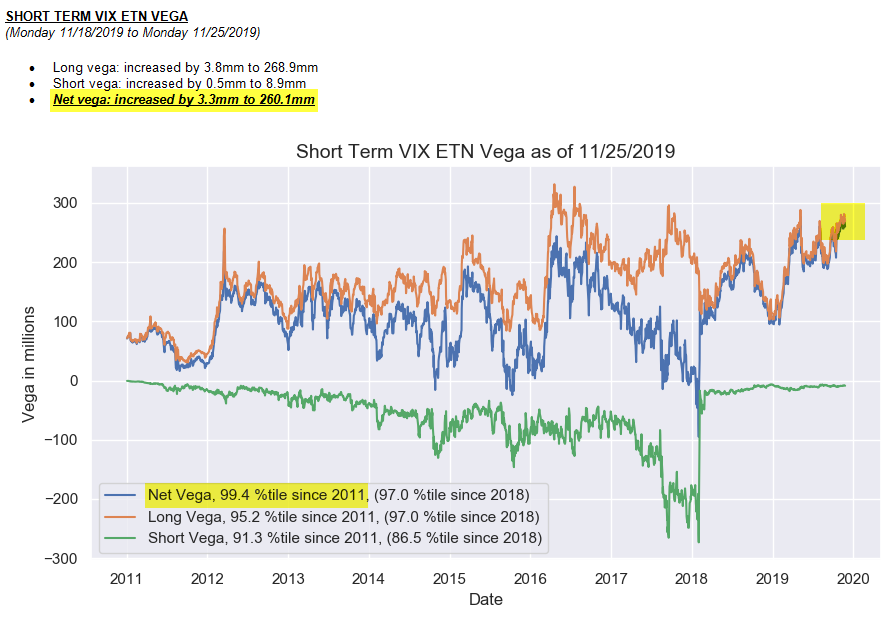
There’s more: as noted above, there is an additional boost to equities via the vol complex, and specifically courtesy of VIX ETNs, where McElligott points to an “insane” 99.4 %ile “Net Long Vega” position, which “continues to mean rebalancing flows which sell UX1 fut to buy UX2—creating extremely outsized “SELL VIX” flows as a “second-order”catalyst for higher stocks.” As a reminder, it was a mirror image of this picture, when net Vega hit a record low, that sparked the February 2018 VIXtermination.
Putting the above together to explain yesterday’s market action, McElligott says that on Monday we saw an extension of the recent grab from clients to get their “Net Exposure” longer to capture this overall move in index, as shorts were violently covered on the day, see Russell 2000 +2.1%, Leveraged Balance Sheet +3.5%, High Realized Vol basket +2.2%, 1Y Price Momentum Shorts +1.3%, although some have speculated that a reason for yesterday’s massive short squeeze was an unwind of Moore Capital’s short book.
* * *
So while the above makes sense if one looks at stocks as nothing more than a self-fulfilling prophecy, which works for a while at which point everything reverses, how does one explain the recent slump in yields?
According to McElligott, Treasuries “simply cannot sell-off” despite upcoming supply in front of the holiday shortened week (5s today, 7s tomorrow) and the clear multi-week pivot from a risk-asset market which was “long worst-case scenario and short good news” which was the narrative for much of 2019, where locally we see more of the same “bull-flattening” in US curves despite new overnight headlines that the US and China have reached consensus on properly resolving relevant issues around “Phase 1.”
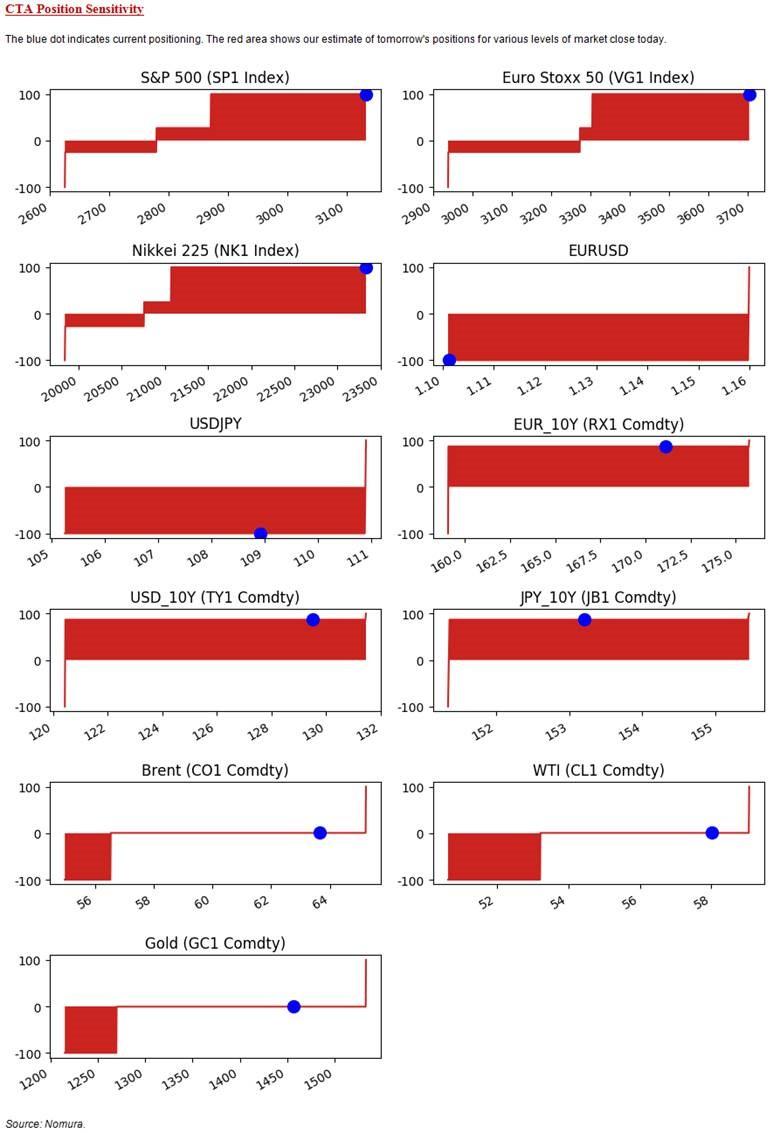
One simple reason: the previously discussed dynamic where CTAs have not only stopped selling, but are back to “100% long”, to wit:
Systematic Trend performance shows us that the strategies have by-and-large increasingly “loaded” the 1Y model window in Global DM Bonds (as it remains deeply “in trend” as the strongest signal across other tenors), thus we see the aggregate signal in the Nomura QIS CTA model for the entirety of Bond futures we track back at “+87% Long” in USD 10Y / EUR 10Y / JPY 10Y / GBP 10Y / AUD 10Y / CAD 10Y // CHF 10Y / FRA 10Y and ESP 10Y, while the signal for BTPs is actually back at “+100% Long”
The Nomura strategist also notes that the signal in Rates futures for CTA have almost entirely weighted the 1Y window, “meaning that the signal remains deeply “in-trend” and thus a “+87% Long” signal across ED4 / ER4 / YE4 and L4”
So what does all this mean for the coming next few days in the market? Here is McElligott’s conclusion:
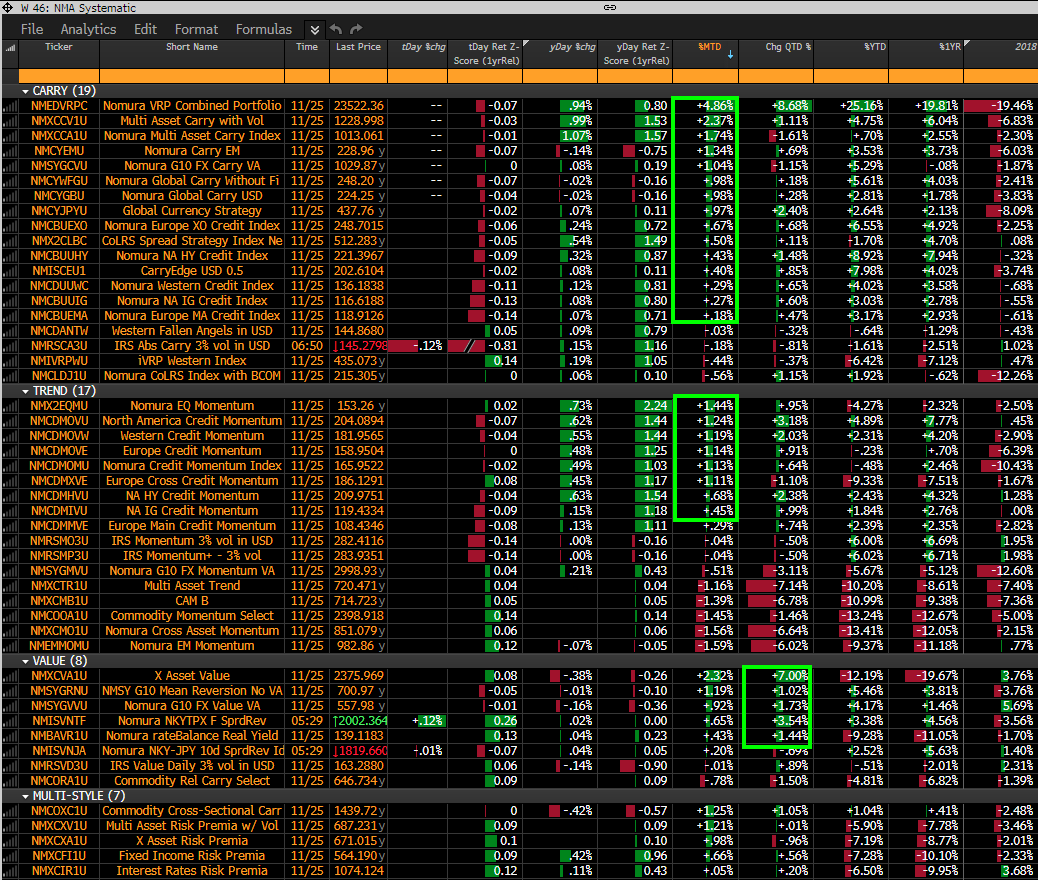
- With the volatility suppressing market dynamics noted above, this resumption of the “Everything Duration” rally over the past 2.5 weeks has then stabilized various cross-asset risk-premia/factor strategy performance (see table at bottom)
- This is particularly notable via the performance reaccelerate across “Carry” strategies, while then too we’ve seen “Momentum” stabilize (particularly across Equities- and Credit-)
- Conversely, the Oct thru beginning of Nov “reversal” too boosted the performance of Cross-Asset “Value,” now +7.0% QTD after a brutal 2019 YTD performance environment (in light of consistency of trend strength / lack of ‘mean-reversion’)
Tyler Durden
Tue, 11/26/2019 – 08:51
via ZeroHedge News https://ift.tt/2OnzKjF Tyler Durden