“Lower For Ever”: One Bank Makes A Stunning Discovery – The Fed’s Rate Cuts Are Now Deflationary
For the past three decades, one of the most frequently asked questions in finance is ‘what has been behind the relentless bull market in treasuries’ (and collapsing interest rates), which have in turn helped push global stocks to never before seen highs amid a bull market that started in the early 1980s and has grown at what appears to be an exponential pace. The main reason for this confusion has been the majority’s strict adherence to the textbook view that the world is cyclical and mean reverting and, thus, declining yields now must surely mean rising yields later on.
Others, such as Rabobank’s Jan Lambregts in contrast, have believed that the forces which have been bearing down on yields are, in actual fact, structural in nature which has not only challenged the mean-reversion investment strategy but also thrown a spanner in the works in terms of cycle-based economic theory. And crucially, as Lambregts writes in his 2020 preview, policymakers’ attempts to provide a cyclical solution to what is a structural problem helps explain developments in the sociopolitical sphere in recent years.
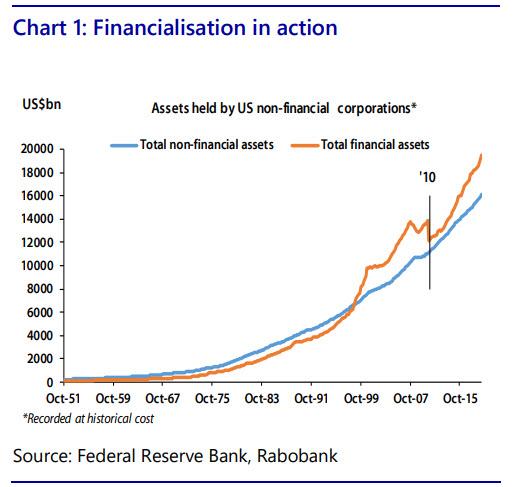
To regular readers of Zero Hedge, and generally contrarians, it will come as no surprise that the structural forces Lambregts is referring to relate principally to our financialization thesis: this refers to a trend that has been evident for decades in Western economies (but arguably increasingly elsewhere in recent years) whereby corporations have increasingly favored investment in financial rather than fixed assets.
The first chart below stylizes this thesis by showing the holdings of financial and non-financial assets on the part of US non-financial corporations since the beginning of the 1950s. As can be seen, since the mid-1990s, US companies have clearly favoured financial investment vs. the “real” thing. 2010 is highlighted on this graphic as it is at this point that the crisis-induced correction in corporate financial asset holdings rapidly reverses. This is attributable to the onset of QE which only served to further encourage corporate investment in financial assets owing to the de facto government put implied by the central bank purchase program.
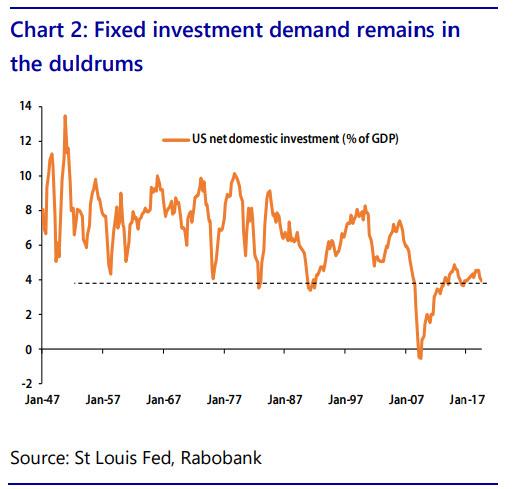
As corporations focused largely on growing their financial assets, the flip side was made apparent in the corporate behavior encapsulated in the next chart, which as ING notes, shows the collapse in net fixed investment demand as a share of GDP during the financial crisis and the fact that the subsequent recovery has only taken investment’s share of the economy back to the cyclical lows repeatedly forged through the post-WWII period. This, then, helps explain a conundrum economists have been struggling with in recent years which is why fixed investment demand is still so slow this many years after the crisis despite the historical and, in certain instances, record low cost of capital. Rabobank’s thesis argues that corporates have taken advantage of low borrowing costs but not to invest in organic growth but as a means of undertaking financial value engineering.
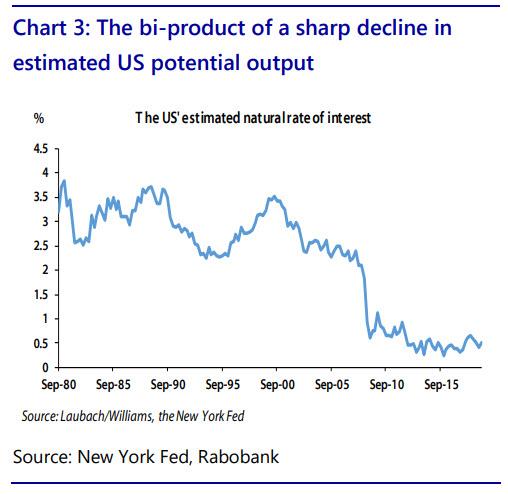
This view also provides a plausible means of addressing another post-crisis puzzle which is why productivity growth has remained so low (since 2010, US productivity has been growing at its slowest speed on average in the post-war era). This, as Rabobank further notes, should be no surprise given the clear bias of corporates to accumulate non-productive financial assets rather than undertake productive fixed investment. This, in turn, helps explain why estimates of US potential output have collapsed in the post-crisis period. The chart below highlights this development in showing the sharp decline in recent years of New York Fed’s estimate of the natural, or neutral, policy rate. This is the real policy rate level deemed suitable for meeting the Bank’s dual mandate of full employment and 2% inflation. Crucially, trend growth is a key assumption underpinning this assessment.
This “financialisation” thesis can also help explain the scarcity of developed world wage inflation despite historically low levels of unemployment. In large part, this is owing to the fact that higher wages in the absence of productivity growth implies lower margins. This is a development that has arguably been resisted by Anglo-Saxon companies as higher wages within this context would result in workers enjoying seniority in terms of access to profits vs. shareholders – the very opposite of the share-value maximisation corporate governance model that ING argues has been increasingly prevalent since the mid-90s.
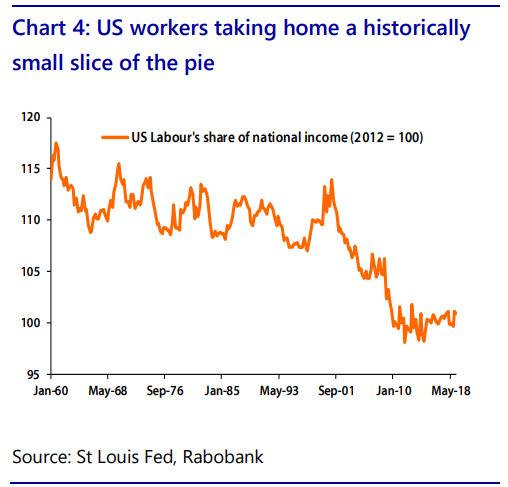
The next chart shows the long-running crowding out of the US workforce in the form of labor’s share of (declining) national income from the 1960s onwards. The chronic nature of this trend reflects the fact that there are other structural forces at play which have been disadvantageous to developed world workers – specifically, globalization and robotization. Yet while these factors have long been widely acknowledged, Rabo’s focus is upon the less appreciated “-ation” – that of financialization.
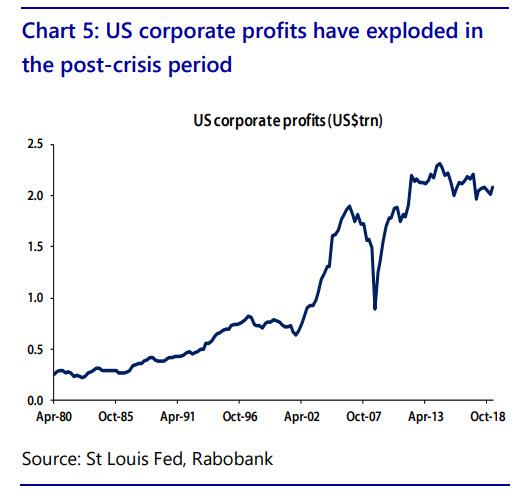
The accelerated crowding out of labor at the turn of this millennium is also reflected in the explosion of US corporate profitability shown in the next chart. Taken together with charts 2 and 4, Rabobank argues that these three visualizations make it clear that these profits failed to make their way either to labor or to fixed investment while Chart 1 implies that financial value engineering was the ultimate destination. Taken together, Charts 4 & 5 reflect a post-crisis development that has been crucial from a social perspective.
To summarize, Rabobank’s core thesis is that recent decades have seen corporates (initially in the Developed world) increasingly avoid fixed investment in favor of that of a financial variety. Central banks have, ironically, accelerated this process by directly intervening in financial markets. The upshot of this has been a rapid appreciation of financial asset values but at the direct expense of real world activity (a cannibalization of fixed investment demand), a concomitant stymieing of productivity growth and, by extension, a crowding out of labor.
In other words, it is central banks themselves that are behind the global economy’s dismal – and ever slowing – growth rate.
Viewed in this way, financialization can be judged to be a zero-sum game whereby what is good news for those long financial assets is bad news for those long income. The divergence of the lines in Charts 4 and 5 thus reflects a yawinng inequality gap that has grown markedly in the post-crisis period. This, in turn, has resulted in a growing segment of developed world populations becoming disaffected as they fall further behind and are, as a result, increasingly looking for nonestablishment political solutions. This is not simply of sociological interest but also of keen strategic importance as it argues that populism itself is structural in nature – it is a struggle for a fairer slice of the pie.
Translation: those central bankers still stumped by what trigger event unleashed Brexit, Trump and a wave of populist anger across the entire world, should look in the mirror.
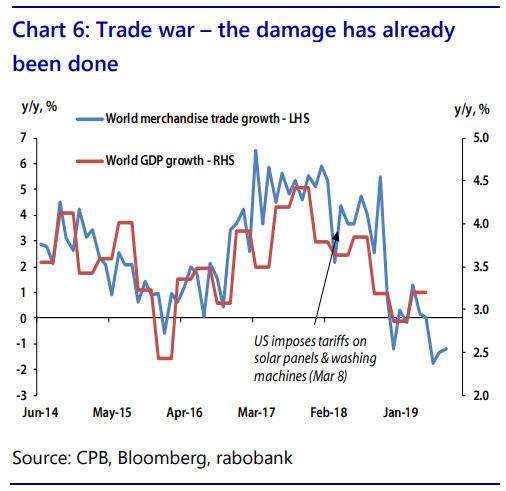
This push for redistribution underpinning the populist groundswell – and the 2020 Democratic primary – is taking the historically consistent from of pushing for redistribution from foreigners to domestics which, in resulting in the erection of real and metaphorical walls (tariffs, Brexit, the US-Mexico wall), is both creating cross-border frictions and weighing on confidence more broadly. As a result, the pie itself will grow more slowly and may ultimately begin to shrink only intensifying the struggle for a fairer slice.
The next chart shows that notable damage has already been done, with the contraction of global merchandise trade growth portending a notable deceleration in world output even if trade-related tensions do not further intensify.
According to Lambregts, “this structural view of the world is crucial given the fact that politics is currently driving the market and politics, by its very nature, is noisy.” The above framework also allows the investor to look through this noise as it highlights the fact that Brexit/trade wars/the broadening out of social unrest in apparently unconnected parts of the world are but symptoms of a broader problem of growing inequality. As a consequence, politically-motivated improvements in market sentiment are purely tactical retracements in an otherwise longer-run strategically bullish trend.
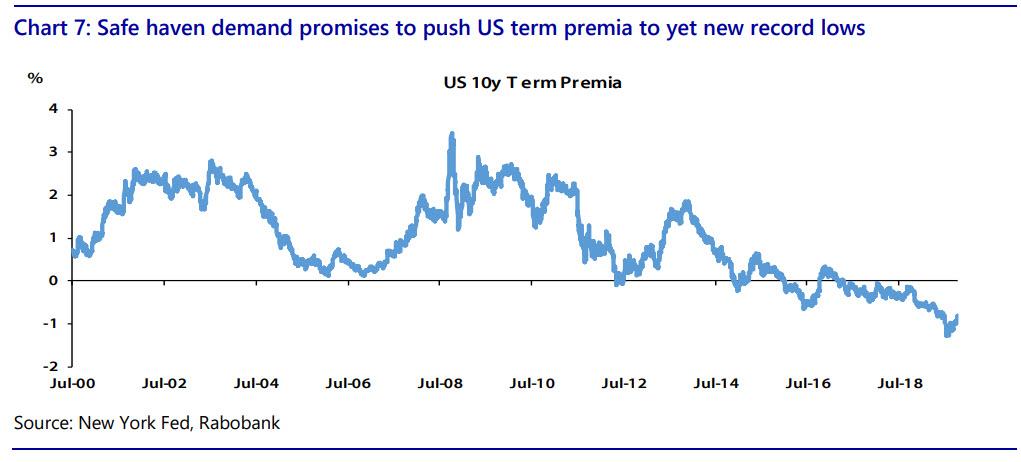
As such, Rabo concludes that populism is here to stay and represents a chronic downside risk to global demand. It also
promises to intermittently trigger flights to quality which Rabobank believes opens the way for US term premia dropping to new record lows in the coming year – Rabo believes that 10Y TSY yields will drop to just 1.00% by the end of 2020.
So what do all of the above structural issues have to do with the current central bank response?
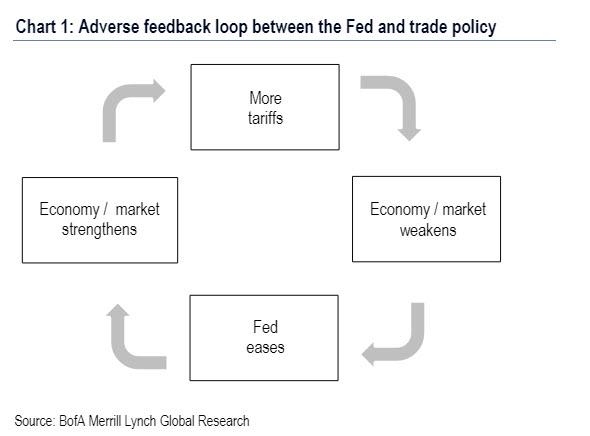
As Rabobank explained next, the Fed is effectively responding to the above structural problems with a cyclical tool – lower policy rates. At best, this cyclical/structural mismatch could be construed as seeing this response as ineffectual; at worst Lambregts warns that “it could actually prove to be self-defeating.” The latter refers to the fact that, in so far as an easier policy stance insulates risky assets (such as equities) from the fallout from elevated geopolitical concern, the Fed is actually be providing President Trump with a freer hand in terms of ratcheting tension with China yet higher, something we discussed in August.
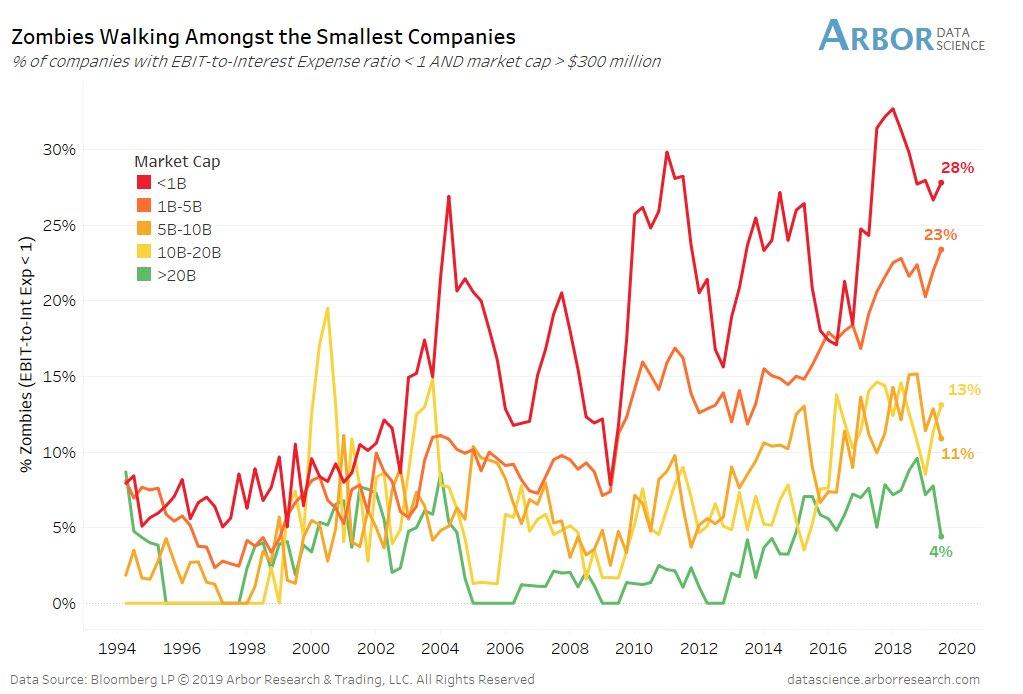
In other words, the Fed is inadvertently enabling Trump in his crusade to protect the US from perceived unfair trading practices and, in so doing, is paradoxically – as we explained in our take of Bill Dudley’s shocking Bloomberg op-ed – increasing the geopolitical threats to growth and inflation. In this way, as Rabobank writes, one could argue that this time really is different in that Fed rate cuts could conceivably have a paradoxically disinflationary effect. One can also make this argument by observing the exponential propagation of zombie companies, kept alive only thanks to low interest rates, and whose very existence is a scramble to capture market share irrelevant of the cost, which of course is profoundly deflationary.
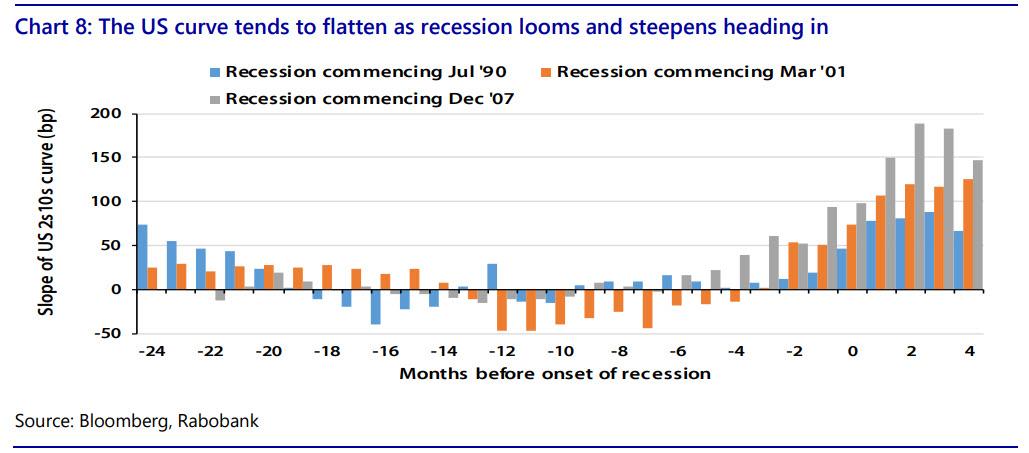
If true, the flattening of the US curve that has been seen heading into previous recessions (as shown in Chart 8 below) could be more intense this time round and the re-steepening heading into the next recession to be less pronounced.
This “this time is different” view has significant resonance with developments in the currency market, the Dutch bank adds. As the Fed embarked upon what it itself has branded a “mid-cycle adjustment”, the consensus very strongly favored a concomitant weakening of the dollar on the back of diminishing rate differentials. This view, as both we and now Rabo, noted missed three key points.
- First, the Fed has been cutting rates owing to mounting downside risks to growth but growth has been slowing much faster outside of the US (which is dollar positive).
- Second, geopolitical tension (potentially underpinned by Fed stimulus itself) has underpinned demand for safe assets (dollar positive).
- Third, an escalation of the trade war lends itself to speculation over a narrowing US trade deficit which, in reducing the global supply of dollars, is a further positive for the greenback.
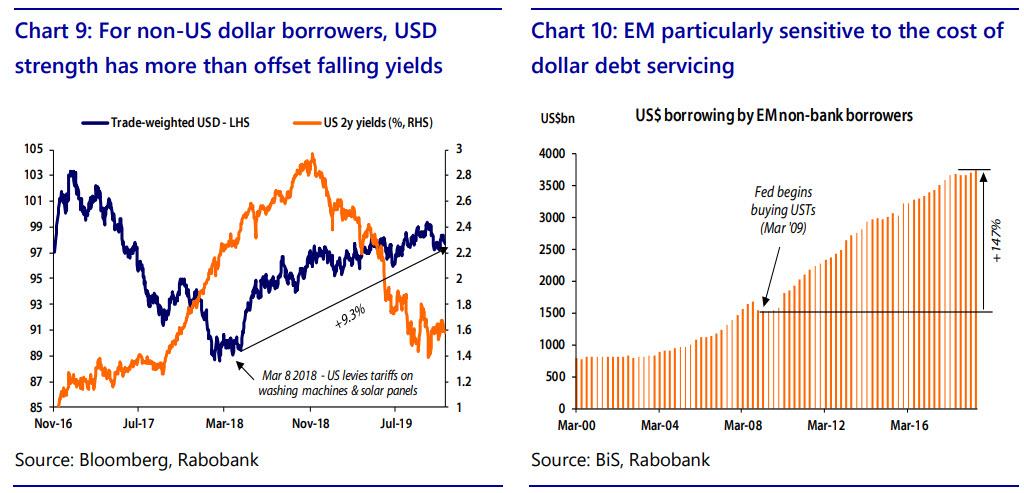
This is shown in Chart 9 above which shows the trade-weighted dollar from November 2016 (when Mr Trump became President Trump) to now. As shown, Trump’s accession to the White House triggered a long run decline in the dollar which was subsequently reversed with the onset of the trade war (appreciating by a little over 9% from March 2018). Meanwhile, as also shown above, short-dated US yields have collapsed in recent months as the escalating trade war triggered a policy turnaround by the Fed. The reason for plotting these two series side by side is to throw into relief the fact that, for those who have borrowed dollars outside of the US, any hoped for decline in the cost of servicing these obligations from lower rates when it comes to rolling them over is more than offset by the sizeable increase in repaying these debts from a local currency perspective.
Nowhere is this a more acute concern than for emerging markets, where dollar borrowing exploded in the wake of QE (and the accompanying lowering of dollar borrowing costs effected by the purchase program). Chart 10 above is based on BIS data which shows that dollar borrowing on the part of EM non-bank borrowers has jumped by 147% since the Fed first started buying USTs in March 2009. The added cost of rolling these debts over owing to the dollar’s resurgence represents a key threat to global growth and one the BIS has regularly highlighted.
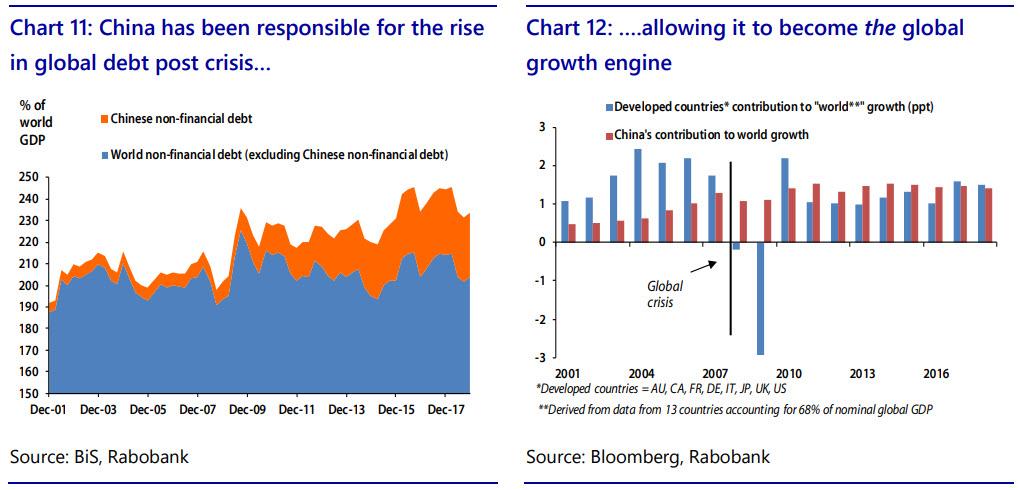
Taking a closer look at EM debt, Chart 11 below shows world non-financial debt as a share of world GDP (the blue area) together with Chinese private non-financial debt also expressed as a share of world GDP. As can be seen, the rise in global indebtedness in the post-crisis period is accounted for entirely by increasing Chinese leverage. This is key as this explains our long-running thesis why China successfully became the global growth engine over the past decade. This is further demonstrated in Chart 12 which shows Rabobank’s estimates of the percentage point contribution to world growth on the part of developed countries and that on the part of China alone. Since the Global Financial Crisis, China has, on average, accounted for one half of the increase in global output. Finally, this also explains our long-running argument (refreshed most recently just two weeks ago in “Here’s The Simple Reason Why A Global Economic Recovery Is Not Coming” ) that absent a recovery – and fresh growth – in China, the world is doomed to recession if not worse.
So in addition to the higher cost of EM dollar borrowing, the rapid build-up of debt within the region also raises a clear question mark over the outlook for global demand. EM non-financial debt currently stands at 183% of EM GDP vs. 107% at the end of 2008. While it is hard to predict how far these liabilities could yet rise before a crisis is triggered, it is safe to suggest we are closer to the end than the beginning of this process. As a consequence, and in sharp contrast to 2008, it is hard to see who will step in to support demand as the current global slowdown unfolds. In the absence of Deus ex Machina (Deus ex Ma-China?), the current low level of long-dated yields in the developed world appears perfectly logical if not poised for an additional leg lower.
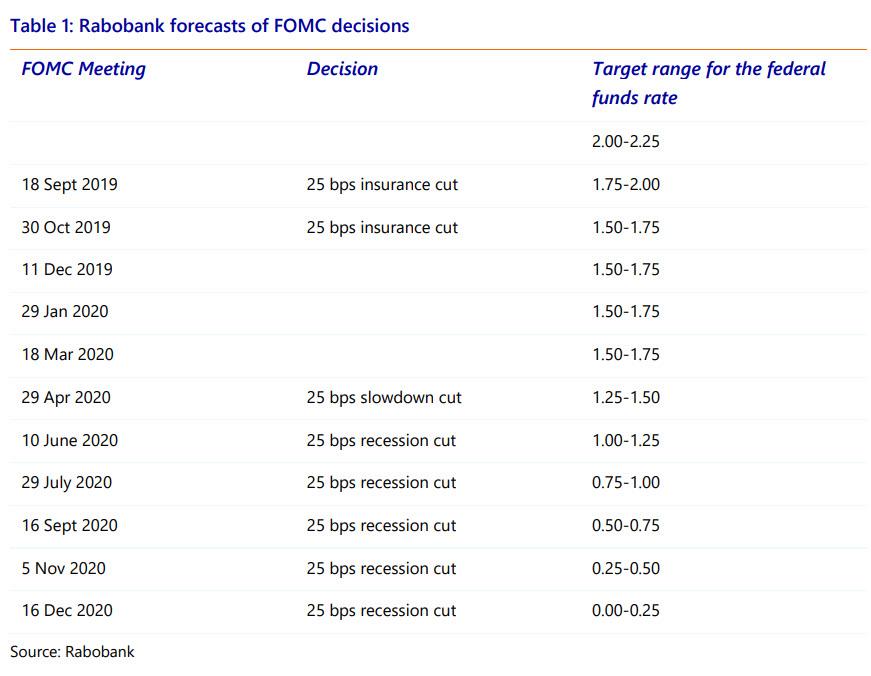
In light of the gloomy structural framework detailed above, it will come as little surprise that Rabobank’s outlook for rates is not so much “lower for longer as lower forever.” Charts 13 and 14 below show the bank’s forecasts for US policy rates and yields through to the end of next year. The bank’s Fed watcher, Philip Marey, who has been spot on in his Fed calls in the past two years, expects the Fed to be forced into cutting policy rates once again in April 2020 as a slowdown becomes more pronounced. With this deceleration of activity seen triggering a recession in the second half of next year, Rabo’s base case is for the Fed to cut rates at each subsequent meeting taking the lower end of the fed Funds target range to zero by the end of the year (a development that will naturally prompt discussion of another wave of, self-defeating, QE in addition to the NOT QE we have right now).
Finally, in terms of specific asset price targets, Rabo expects 10y yields to hit a new record low in H2 2020 with 1.0% currently viewed as the resting point at the end of the year, and strikingly, the bank states that it views the risks to this forecast “to be titled to the downside”!
Perhaps 2020 is the year when NIRP finally comes to the US? And while purely anecdotal, this view was endorsed by the 15 accounts that Rabo’s rates strategists visited on the US East Coast in October. The question they received most regularly from these investors was not whether USTs offered value (the clear consensus was that they most certainly do) but rather “what the likelihood was of US yields ultimately ending in negative territory. “
Tyler Durden
Tue, 12/03/2019 – 15:33
via ZeroHedge News https://ift.tt/2YbfRPU Tyler Durden
