Morgan Stanley: Central Banks Are Injecting $100 Billion Per Month To Crush Vol And Spike Markets
One week ago, in response to the recurring question whether the Fed’s latest direct intervention in capital markets is QE or is NOT QE, we answered by looking directly at how the market itself was responding to the Fed’s liquidity injections.
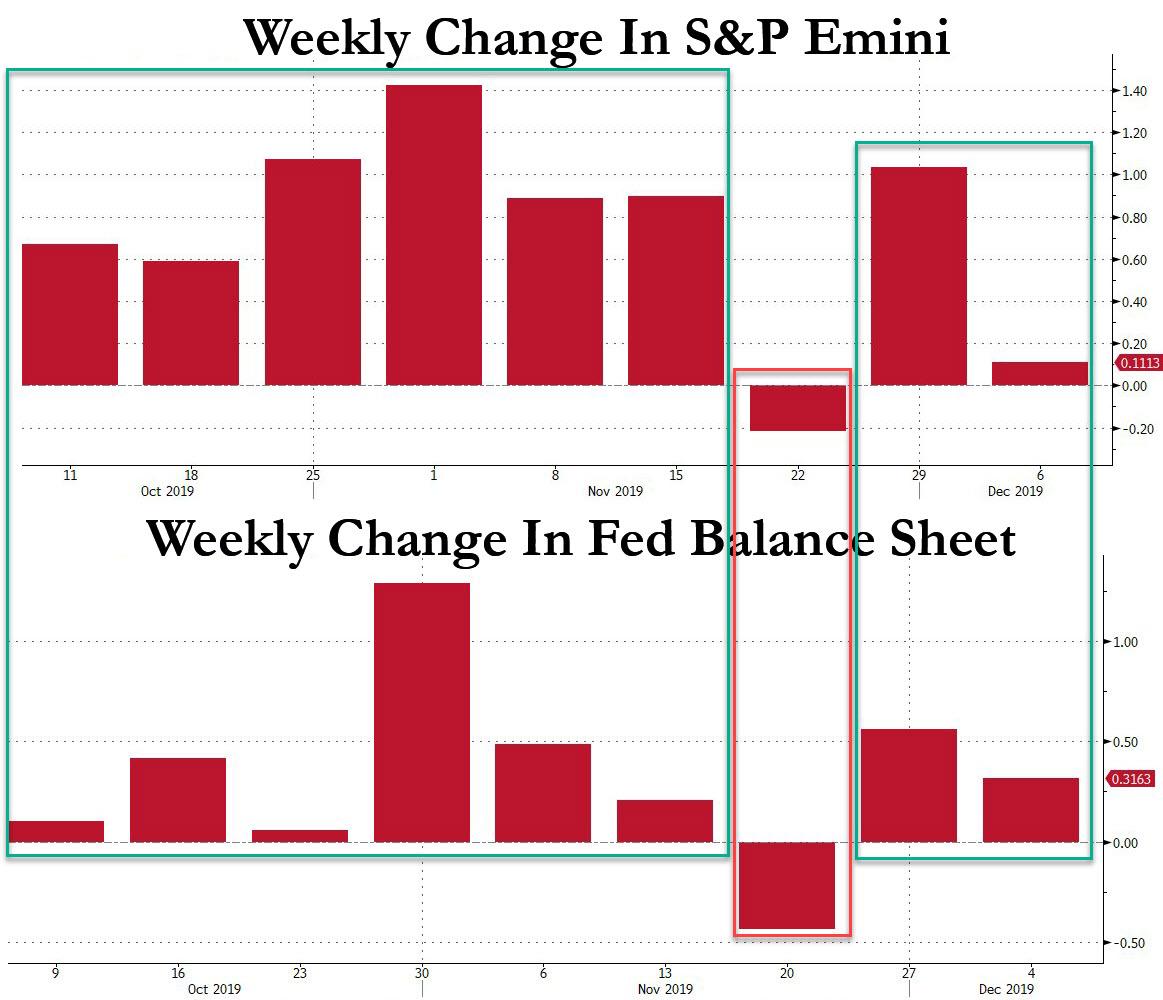
The answer was clear enough: just like during the POMO days of QE1, QE2, Operation Twist, and QE3, stocks have risen in every single week when the Fed’s balance sheet increased, following the three weeks of declines that led to the October 11 announcement. What about the one week when the Fed’s balance sheet shrank? That was the only week in the past two months since the launch of “NOT QE” when the S&P dropped.
And yet, some doubts still remains.
As Morgan Stanley’s Michal Wilson writes today in his Weekly Warm Up piece, “in recent marketing meetings, several clients have asked if we think theFed’s $60B/month balance sheet expansion is QE or not.” In response, Wilson gives the podium to MS interest rates strategist Matt Hornbach who says that it’s “Q” but not “QE.” In other words, “there is little debate that the Fed is increasing the quantity of money, or Q. However, they are not taking duration out of the market so the additional money lacks a direct transmission mechanism to the equity markets or other long duration risk assets.”
While semantically Wilson and Hornbach are correct, the outcome is obvious: whether it is Q, QE, or NOT QE, the money is clearly making its way to the market when the Fed’s balance sheet expands, and vice versa.
And quite a bit of money it is, because it’s not just the Fed.
As Wilson further elaborates, “we continue to see the 3 largest central banks in the world expand their balance sheets at the rate of $100B per month ($60B from the Fed, $25B from the ECB and $15B from the BOJ).” As a reminder, several years ago, Citi’s fixed income guru Matt King said that it takes $200 billion in quarterly liquidity injections across all central banks to prevent a market crash, and lo and behold we are now well above that bogey.
But wait, there’s more: in case $300 billion per quarter was not enough, last week there was also an announcement that Japan would enact a new fiscal stimulus of approximately $120 billion which could be as much as $230 billion when you include the private economy incentives. That, as Wilson puts it, “is a lot of money.” It’s also an issue for the traditionally bearish Wilson, who as a reminder in mid November got a tap on the shoulder and, kicking and screaming, was “urged” to raise his S&P bull case target to 3,250.
It could go even higher.
As Wilson notes on Monday, “as part of our year ahead outlook published a few weeks ago, we cited this excessive liquidity as a reason why we thought the S&P 500 could trade well above our bull case year end target of 3250 while this policy action persists. As of right now, it appears that the Fed, ECB and BOJ will continue at this pace through the first quarter of next year.”
But wait, didn’t Wilson just say moments earlier that the liquidity injection by central banks “lacks a direct transmission mechanism to the equity markets?”
Well, yes and no. Wilson connects the two, by explaining that in his view, “the central bank transmission mechanism is via suppressed volatility”, to wit:
The recent actions by the Fed were intended to reduce volatility in the repo market but it’s also had the effect of reducing the volatility in risk markets. Exhibit 1 and Exhibit 2 show 30 day realized volatility for the S&P 500 for two periods. The first period is the post crisis financial repression era, and the second is the longer term. As you can see, we recently reached one of the lowest readings of this era when we hit 5.7% at the end of last month after a brief spike in September when repo markets became disrupted.
To put this in context, this reading is in the first percentile of the past 7 years, a time when QE and financial repression has been very active…
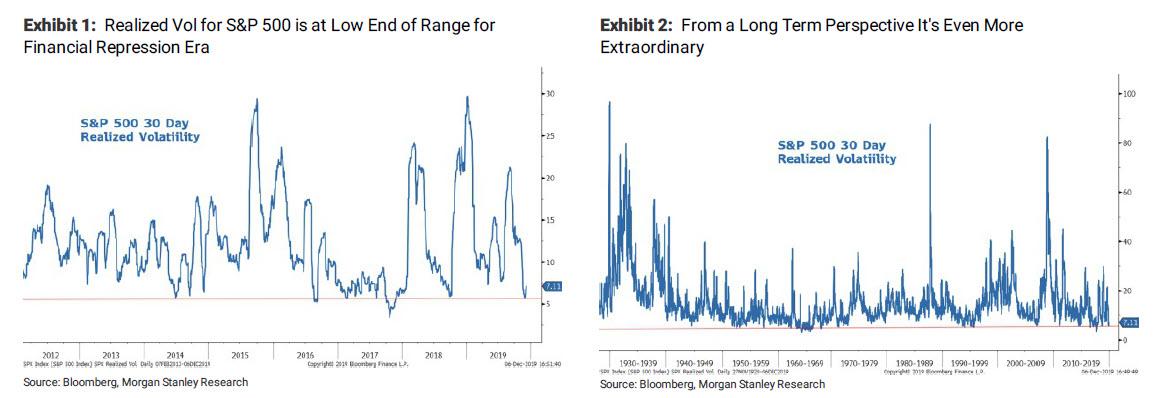
… almost as if QE is active once more.
Now, the reason why the Fed is directly targeting volatility – assuming MS’ thesis is right – is that vol also happens to be the key signal for two of the dominant market investors active today: CTAs and vol-targeting strategies. As shown in Exhibit 3and Exhibit 4, one can see that the flow of funds from these strategies is quite volatile and rather significant in size.
Morgan Stanley’s Quantitative Derivative Strategies (QDS) team estimates that since September, inflows to global equities are close to $175B of which ⅔ ended up in the US. The charts also show the two major downdrafts last year around the volatility shock in January/February 2018 and then the end of the year liquidity squeeze from QT and economic growth deterioration. All that changed in 2019, and this year’s flows have been quite positive with over $300B into global equities cumulatively with a few shocks in May and August to the downside as market volatility increased around escalating trade tensions and then recession fears. With both of those concerns fading recently along with central bank balance sheet expansion those outflows have reversed sharply to inflows.

More importantly, since these two strategies are directly driven by vol, and specifically the lower the volatility, the greater the leveraging, the inflows and the bullish impact on stocks, the more the Fed depresses volatility, the higher stocks rise.
And so, with central banks remaining stimulative with aggressive balance sheet expansion, Wilson notes that vol should remain suppressed in the absence of a breakdown in trade negotiations or hard evidence that the economic cycle is turning down again. (of course we will know as soon as this Sunday if trade negotiations will indeed not suffer a breakdown).
The question then turns to how high Morgan Stanley can reasonably expect the S&P 500 to rise from here if these trends remain stable. The next chart shows how realized volatility is related to the equity risk premium (ERP). Unsurprisingly, the MS equity strategist finds a positive relationship between the two – i.e. falling/rising vol is relative to falling/rising ERP.
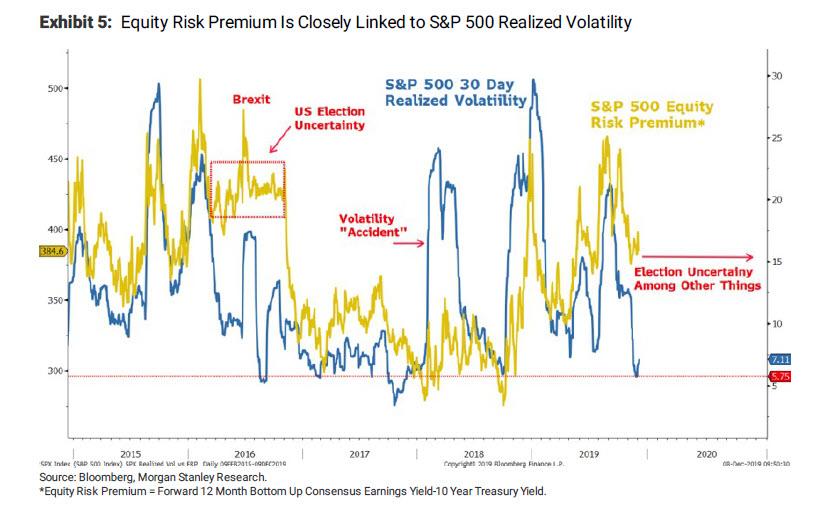
However, there have been some important divergences between the two over the past several years. First, in 2016, the ERP remained somewhat sticky to the upside despite very low realized volatility. This can be attributed to the high political uncertainty during that year due to the US Presidential election and Brexit. There was also a large gap in early 2018 when we experienced a sharp spike in realized vol but the ERP remained quite low. This divergence can be attributed to the observation that the vol shock was more technical in nature and not fundamentally induced. Therefore, the ERP remained low.
Fast forward to today, when we currently observe a third major divergence between the two – the ERP remains more elevated than one might expect based on its relationship with realized vol. So what’s going on now?
Here, Morgan Stanley thinks this makes sense given what is likely to be another heightened year of political uncertainty much like 2016. Trade tensions are also likely to remain even with a phase one deal getting signed. Finally, the bank’s core bearish view is that corporate margins/profitability will continue to be a drag on earnings growth even in the muddle through late cycle scenario our economists forecast for the US.
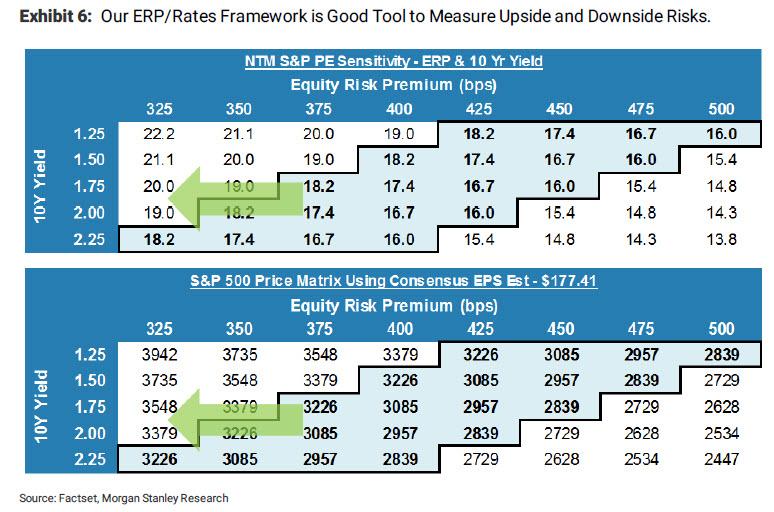
And yet, this is where the upside “risk” to Morgan Stanley’s bullish forecast lies, because the ERP could certainly fall further, which is why Wilson has been highlighting the near term upside risk for the S&P 500 to trade above his bull case target (3250) so long as the Fed and other central banks keep vol suppressed below “normal” levels. Looking at Exhibit 5, it’s fair to argue ERP could fall another 50bps toward 325-50bps if vol stays suppressed. Using the bank’s ERP/Rates framework in Exhibit 6 and assuming 10 year Treasury yields remain close to current levels, the forward P/E multiple could expand another couple of turns. Using the currently consensus forward EPS of $177.42 this means that the S&P 500 might be able to overshoot to the upside in this suppressed volatility environment.
Of course, all of the above was written by a Michael Wilson who is merely covering his (bearish) ass in case the S&P does hit 3,400 which as emerged earlier today, is JPMorgan’s as well as Goldman’s 2020 target. In an ideal world, where the Fed had not launched QE, Wilson’s tone would have been decidedly different. Which is also why he adds the footnote that “this is not our base case assumption, mainly because we think the ERP should remain at current levels, or higher, given the uncertainties around politics, policy and earnings growth for next year.”
A little more of Wilson’s bearishness shines through when he says that he is confident the current consensus forecasts for earnings next year remain 5-10 percent too high. However, he concedes that the market will use the consensus numbers as its best guess/most likely outcome at least until their are proven wrong. Here, just like this year, the reduction in forward EPS is bound to be slow as companies are loathe to reduce forecasts until they absolutely have to, and analysts rarely deviate far from company guidance.
Having offered the market his bull – and even mega-bull – case, Wilson is then allowed to revert back to his normal, bearish self, and pointing to last week’s jobs data and consumer confidence data which “were well received by equity investors,” he notes that “the action in the bond market and our cyclicals / defensives ratio left a lot to be desired.”
Specifically, the strategist notes that despite what has been a series of better data points on the economy and forward looking indicators, both the 10 year Treasury Yield and his cyclicals/defensives stock ratio remain well below key resistance levels. In fact, both are still close to their lows in 2016 and below levels reached last December!
This makes sense and in in fact confirms Wilson’s view that “downside risks to growth remain higher than upside risks”, especially since the S&P 500 is a very defensive equity market and could be viewed as its own asset class that received a unique allocation in passive portfolios. Meanwhile, the greatest risk in the equity market remains in growth stocks where expectations are too high and priced. From a sector standpoint, this is consumer discretionary broadly and expensive software and secular growth stocks. Since then, Wilson notes that these groups have underperformed and Morgan Stanley thinks that this will continues. Indeed, while consumer discretionary group had a decent day on Friday but its relative performance was still slightly negative remaining well below its 200 day moving average and appearing to be completely broken technically. Broadly, software had an even weaker day on Friday relative to the market capping a poor week and leaving its relative performance in a precarious position technically.

Looking at the chart above, one can argue that the consumer discretionary line – which is now far below its 200DMA -is now in a breakdown. Why is this notable? Because as Wilson concludes, “consumer discretionary is an early cycle sector and we are clearly late cycle.” While the stocks had a good 2018 and first half of 2019 because US consumers have benefited from the tax cuts and have been spending well above trend, “this above trend spend however is likely coming to an end.” So, even though the consumer is healthy and likely to continue to spend, he is unlikely to spend at the pace of the past few years, Wilson concludes.
Which brings us to his bearish punchline (at least as much as he is allowed to be bearish), to wit: “stocks are now beginning to discount that slowdown and we think there is likely more downside given the early cycle properties of these stocks in what is a late cycle environment.”
Of course, the materialization of this worst-case scenario would just mean even more QE from the Fed, which would then bring up the last -for this cycle – scenario we discussed over the weekend in “When We Fall Back Into A Recession And Real QE Returns, Watch Out.“
Tyler Durden
Mon, 12/09/2019 – 19:07
via ZeroHedge News https://ift.tt/2PweLKG Tyler Durden