Central Banks Have Made Markets So Fragile, Liquidity Premiums Are Now Negative
Back in late December, when the market was melting up every single day with zero regard for economic data or newsflow, we pointed out something ominous: the world’s most liquid stock market, the S&P500, was now as (il)liquid as it was during the 2008 financial crisis.
As BofA’s Benjamin Bowler wrote, while market liquidity generally correlated with volatility, in recent years, it was progressively deteriorating despite near record low levels on the VIX. According to BofA calculations, average “illiquidity” for S&P e-mini futures since 2018 has been in its 73rd% since 2008. Historically, the period when markets were less liquid was primarily during the ’08 crisis when the VIX was north of 40.
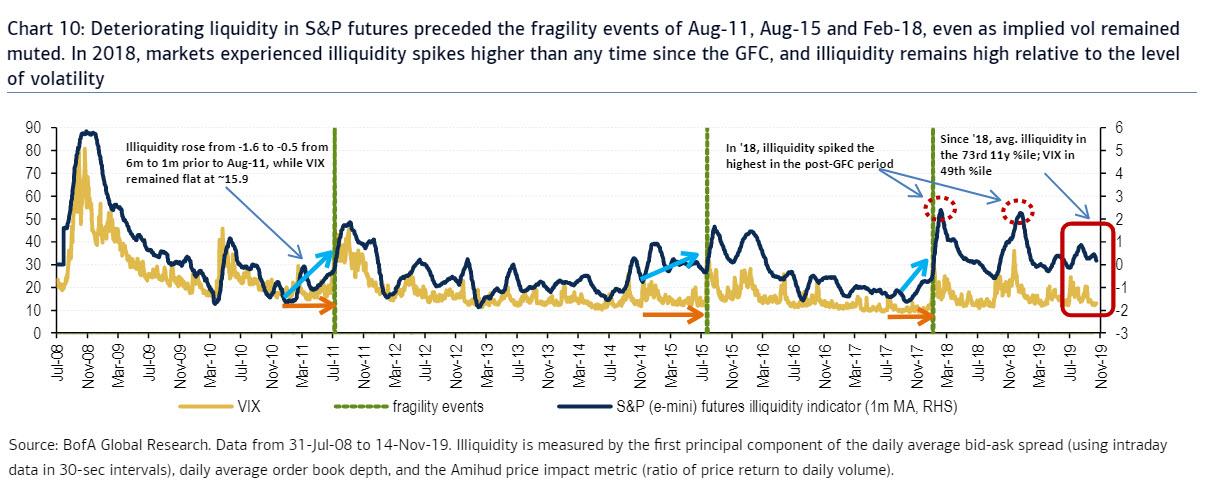
It is also noteworthy that illiquidity rose ahead of the sharp fragility events of Aug-2011, Aug-2015, and Feb-2018, while implied vol remained muted until very near the selloffs, suggesting that VIX no longer reflects prevailing market stress, and confirms what Morgan Stanley said in late 2019, namely that Fed actions now directly seek to lower marketwide volatility.
Why does this matter?
Because as BofA summarized one month ago, the fact that liquidity seems to be progressively deteriorating over time suggests that market fragility is getting worse, particularly as long as crowding remains a problem and liquidity providers are incentivized to pull back from liquidity provision in times of stress.
Wait, what fragility?
While we have extensively discussed the growing fragility of the market, manifesting itself in ever more frequent liquidity “air pockets” and “flash crashes”, here is a quick reminder, once again courtesy of Bank of America, which writes that despite the direct suppression of volatility by central banks, “markets have remained highly fragile in recent years.”
The left chart below shows that BofA’s fragility measure for the S&P 500 exceeded global financial crisis (GFC) levels during 2018 despite volatility remaining at or below its longer-run average. In fact, as the chart on the right shows, fragility across 25 markets covering five asset classes has been historically elevated vs. volatility in recent years.
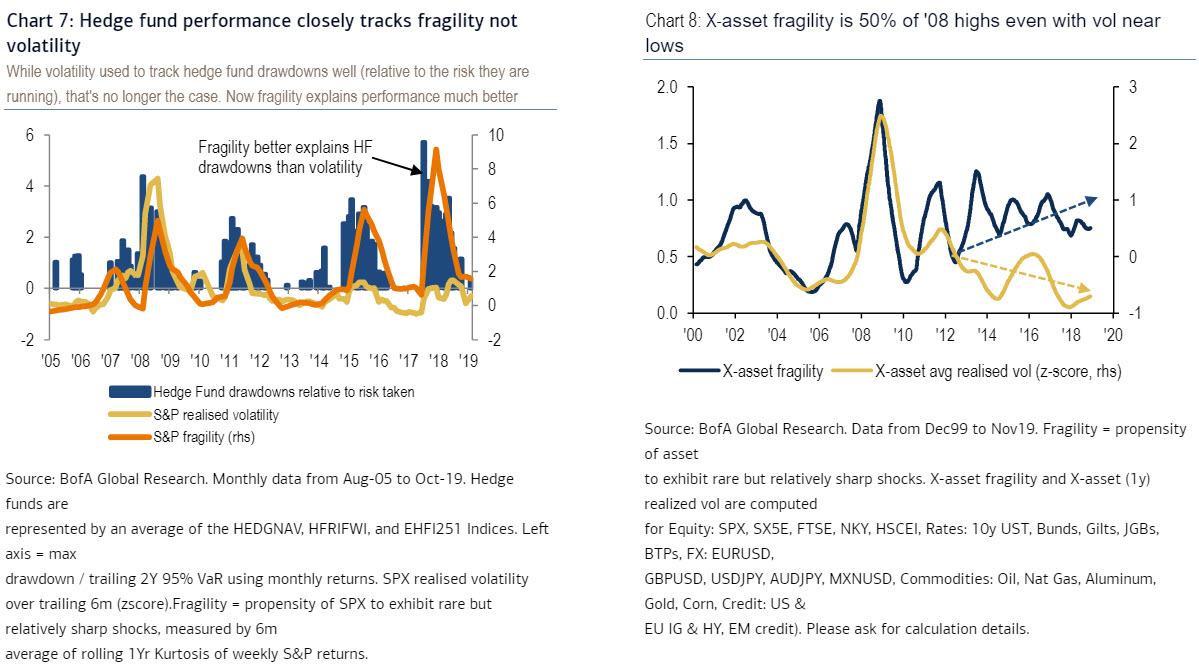
This matters because as Bowler notes, it is fragility – not volatility – that is a better measure of the risk that active managers are exposed to. In this vein, BofA believes that high market fragility in the past few years (which corresponded to relatively large hedge fund drawdowns) “is driven by a combination of investor crowding in an alpha starved market and the increasingly fickle liquidity provision from high frequency traders (HFTs).“
Fast forward to the end of January when we got a very clear example of what happens when fragility and black swan (or perhaps black bat) events collide.
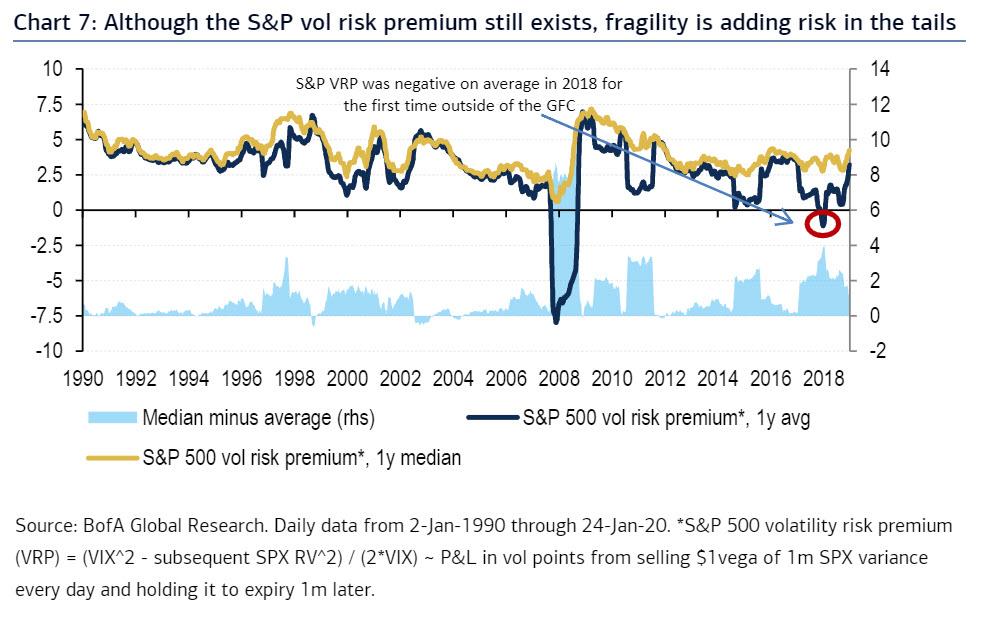
As Bowler writes today, “fragility risk remains real – as seen from the -3.2 stdev drop in the S&P on 27-Jan following a near-record Sharpe of 6.3 over the prior 3m” and is driving a paradigm shift in harvesting the equity volatility risk premium (VRP).
The S&P volatility risk premium – long one of the most persistent across derivatives markets – has been especially hard hit, turning negative on average in 2018 for the first time outside of the GFC and struggling to revive itself in 2019.
BofA attributes this to:
- (i) a supply-demand shift in S&P options usage (towards more robust supply from yield-starved investors and weaker hedging demand from under-positioned equity investors), as well as
- (ii) high market fragility (i.e., large dislocations in price relative to the prevailing level of volatility), which has altered the distribution of the SPX VRP in recent years by pulling its average well below its median
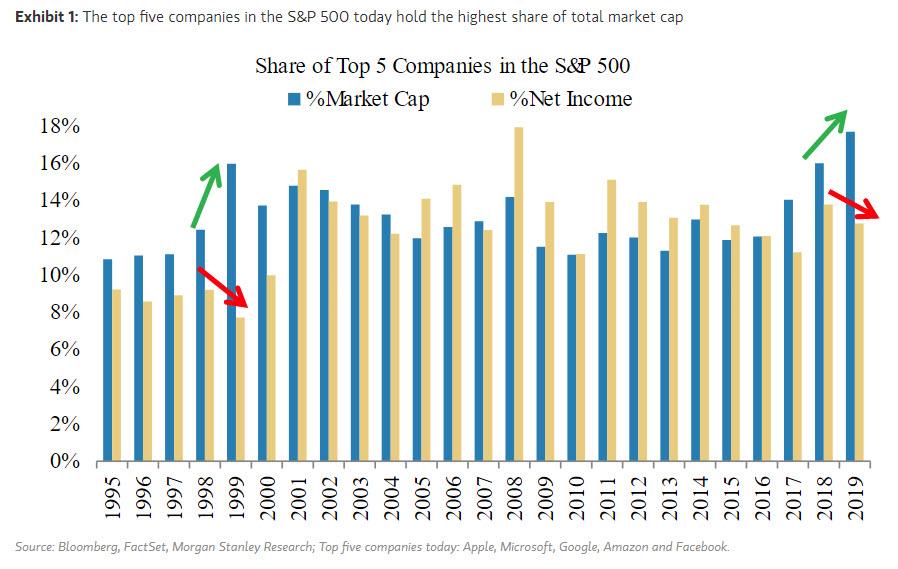
Looking to 2020, more bullish US equity positioning (as the Fed increasingly pulled investors back into the recent rally where there wasn’t a single +/-1% market swing in 70 days ) could restore healthier demand for S&P hedges in sell-offs, according to Bowler. However, in yet another irony, more liquid markets now tend to perversely experience more acute fragility events, as they attract a broader array of trading activity. In other words, superior liquidity equates to higher crowding risk, which translates to greater realized fragility in markets today. One needs to only recall the “other 1%”, namely that the top 5 companies in the S&P500 make up a record 18% of total market cap, more than the dot com era, to get a sense of what’s going on.
Alas, with the S&P being the most liquid equity market in the world, “and to the extent that central bank-induced financial repression continues to incentivize yield-starved investors to sell short-dated S&P options/vol for income, headwinds to the SPX VRP likely remain”, according to BofA.
What’s the remedy?
According to BofA’s chief derivatives strategist, beyond adopting more defensive approaches to VRP harvesting, investors should look to diversify away fragility risk. Sizing is also critical to the risk management of short volatility positions, and applying more conservative sizing schemes to assets prone to fragility shocks can help limit the contribution of such assets to broader cross-asset risk premia portfolios.
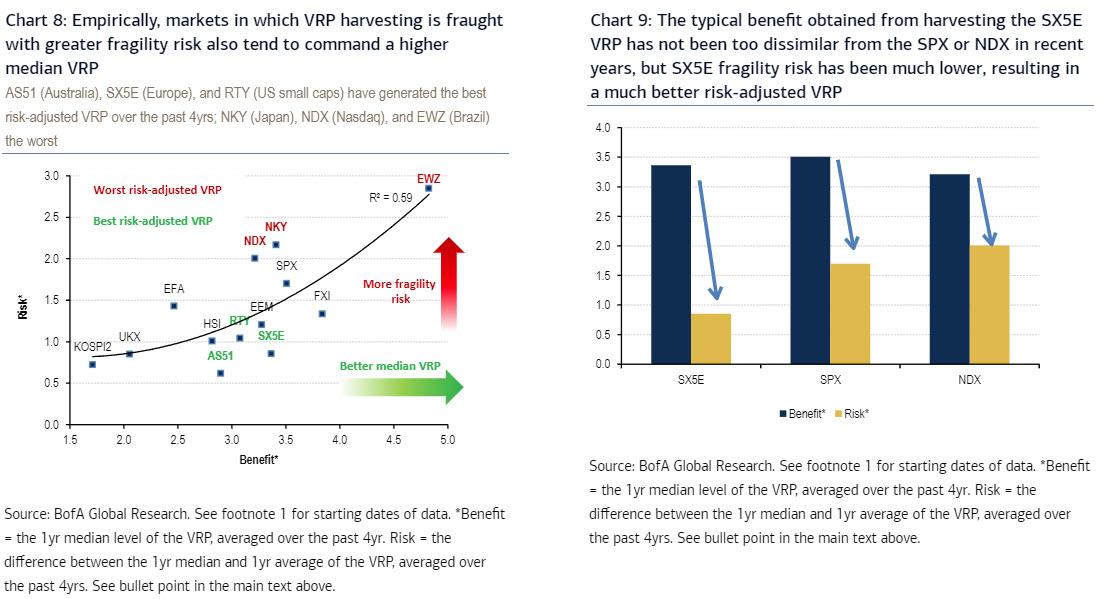
What does this mean in practical terms? While the S&P does not rank at the very bottom of the screen, it still ranks among the worst (and sits above the regression line in Chart 8). Importantly, what makes the S&P/Nasdaq rank so poorly vs. SX5E is not the benefit side of the equation, but instead the fragility risk (see Chart 9). Indeed, the Stoxx 50 has the second-lowest fragility risk metric among the markets considered (i.e., selling vol on SX5E has been one of the safest opportunities for vol sellers among popular global equity indices over the past 4 years; see Chart 10). Hence, it is ironic that selling vol in markets which some would consider as having better fundamentals (e.g., US large caps or US Tech) has become a worse investment proposition than selling vol on markets with the some of the worst fundamentals (e.g., European equities or US small caps).

In conclusion, and consistent with the notion of a negative liquidity premium, whereby more liquid markets like the S&P are ironically more vulnerable to fragility shocks, BofA finds that selling volatility on markets with worse fundamentals – e.g., European equities (SX5E) – has perversely become a better investment proposition than selling volatility on US large caps. Paradoxically, VRP “harvesting” on the Stoxx 50 has never been safer vs. the S&P or Nasdaq over the past 20 years. This leads BofA to conclude that “S&P vol sellers should efficiently diversify away fragility risk.”
Of course, they won’t and instead the crowding will continue until one day the market crashes and the Fed is unable to spark the BTFD rebound, resulting in what will likely be the first ever market-wide halt that will last for a long time until clearing prices based on fundamentals and not liquidity are rediscovered far, far lower.
Tyler Durden
Tue, 01/28/2020 – 12:25
via ZeroHedge News https://ift.tt/2GzeHpi Tyler Durden