In The Past 30 Years, The “Top 1%” Has Bought $1.2 Trillion In Stocks; The “Bottom 99%” Has Sold $1 Trillion
For years, the market had been stumped by what in 2019 we dubbed a “great conundrum” – namely, how was it possible that equity funds were liquidating stocks at a furious pace, with outflows hitting a post-crisis high last year, and yet stock prices not only kept hitting daily all time highs but unleashed a furious meltup in September which has lasted to this day?
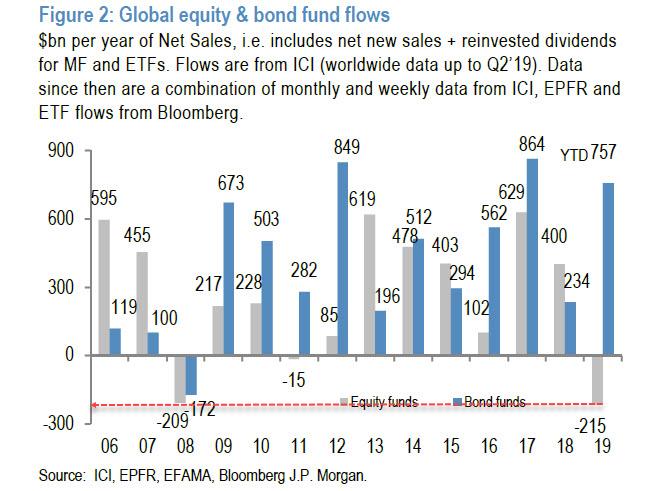
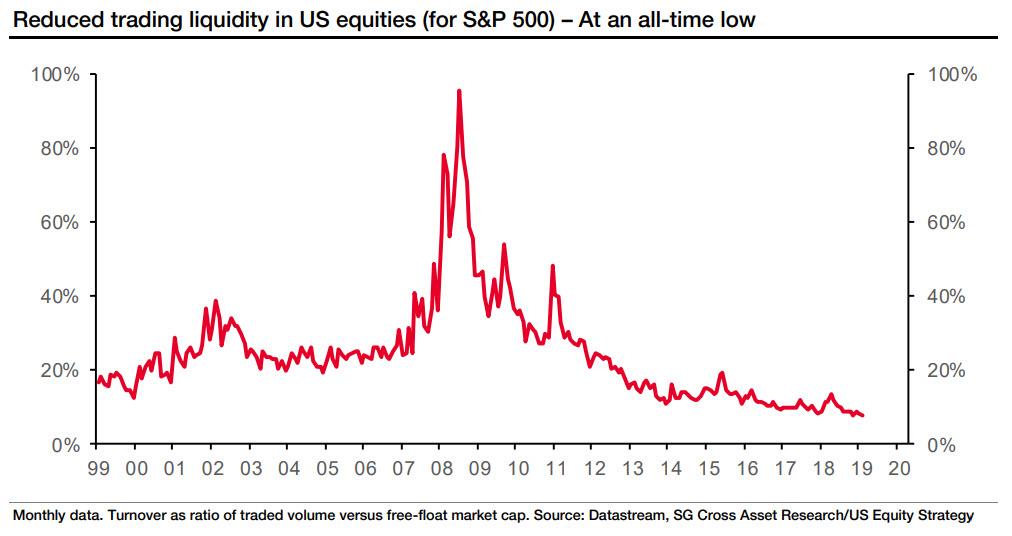
Some suggested answers, most notably SocGen, which explained that the offset to fund selling was record (and price indiscriminate) stock buybacks which, due to prevailing market illiquidity, had a disproportionate bullish impact on price discovery, to wit: “the lack of market liquidity, as measured by S&P 500 turnover – the ratio of trading volume vs free float market capitalization – has exacerbated the impact of share repurchases on US equities.”
And while intuitively that explanation did make sense, it did not seem complete: was there some aspect of investor selling (or buying) that was being ignored by the market, which was simply focusing on aggregate fund flow numbers?
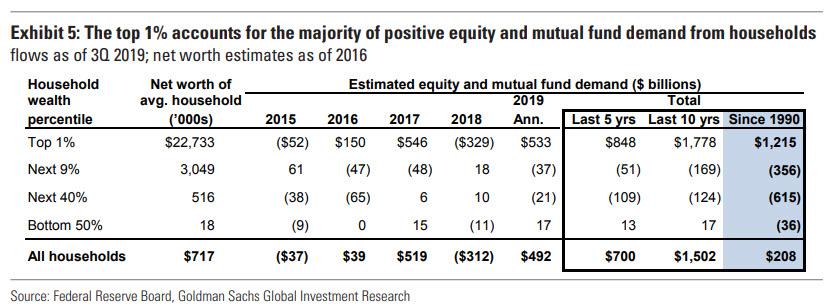
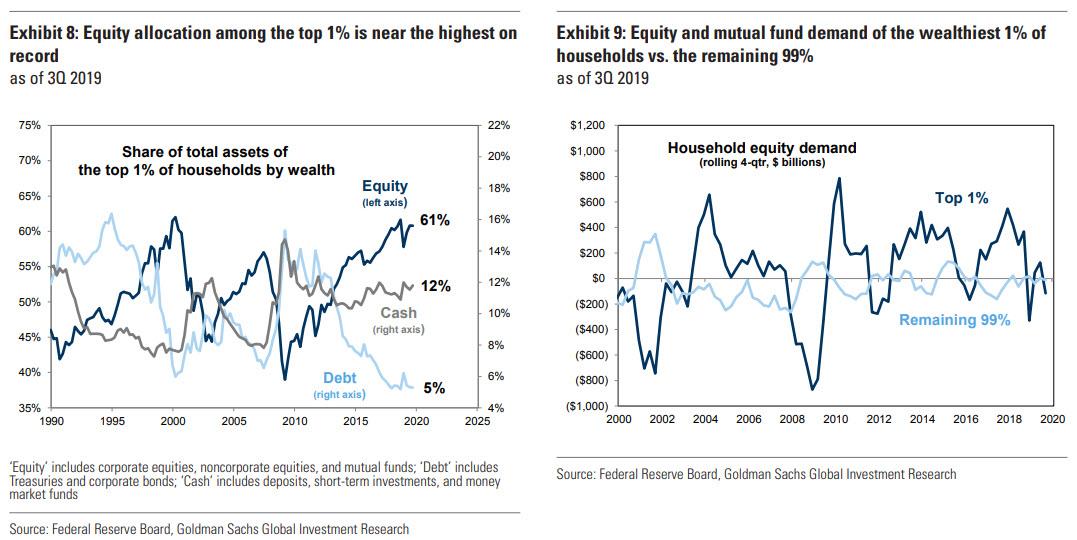
As it turns out, the answer is yes: according to a just released analysis from Goldman’s Arjun Menon, household equity purchases have been driven solely by the wealthiest 1% during the past 30 years. Specifically, since 1990, the top 1% has bought $1.2 trillion of equities and mutual funds compared with $1 trillion of net selling by the remaining 99%. And, confirming what we discussed in “The Rich Have Assets, The Poor Have Debt“, based on the Federal Reserve’s Distributional Financial Accounts (DFAs), the concentration of household equity ownership among the wealthiest households is at an all-time high.
Where does this buying vs selling differential come from?
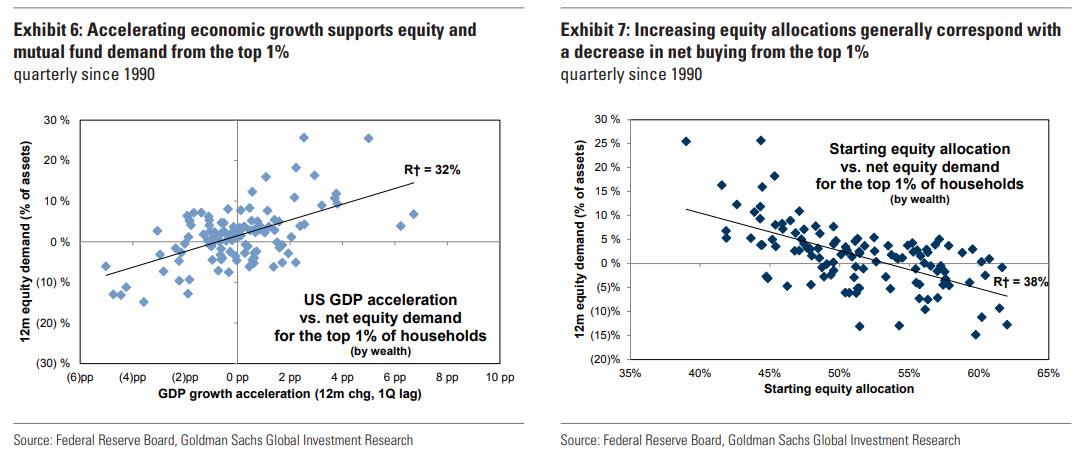
While there are more details in the full report, Goldman simplifies the dynamic by noting that starting equity allocations and US economic growth have been the most significant drivers of equity demand from the top 1%. The wealthiest households typically increase their net buying of equities following periods of accelerating economic growth but reduce demand as their equity allocations rise. Meanwhile, the remaining 99% of households generally buys stocks after interest rates decline, although the current period appears to be an outlier.
Below we present some more details from Goldman, which analyzed the Fed’s newly published Distributional
Financial Accounts:
Using the DFAs, Goldman estimates equity demand from each household wealth subgroup, identifying the factors that drive this demand, and determine the potential implications for equity prices in 2020.
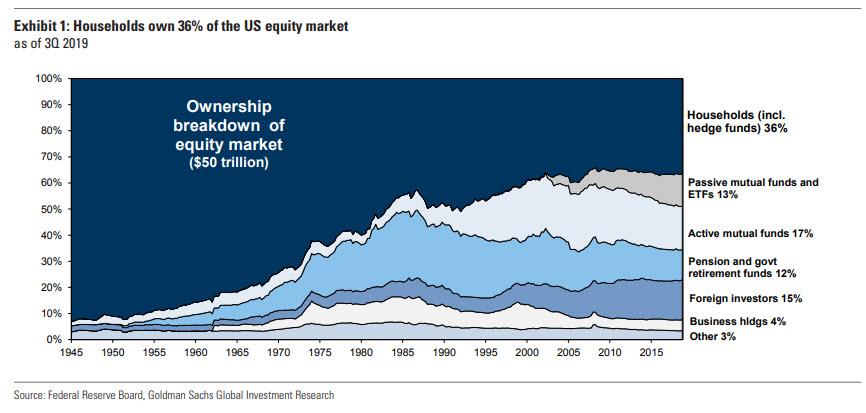
In aggregate, US households own 36% of US equities, which is at least two times larger than any other major investor category. As a result, the concentration of household wealth and asset allocation across US households can have significant implications for equity supply and demand. The “Household” sector described in the DFAs includes retail investors and private funds (such as hedge funds). The DFAs combine aggregate household balance sheet data from the Federal Reserve’s Financial Accounts of the US (Z.1 release) and distribution of wealth from the Survey of Consumer Finances (SCF). Aggregate household balance sheet data include both retail investor and private fund holdings. However, based on the most recent 13-F filings, Goldman estimates that hedge funds own only 10% of aggregate “Household” sector equities. Also, the SCF samples only retail investors (including wealthy individuals) and therefore, the distribution of wealth is also not affected by private funds.
This brings us to the report’s first striking observation: the concentration of household equity ownership among the wealthiest households is at an all-time high. Specifically, the top 1% of US households by wealth owns $21.4 trillion of equities (corporate, noncorporate, and mutual funds), which represents 56% of aggregate household equity ownership. In contrast, the bottom 90% owns $4.6 trillion of equities (12% of total).

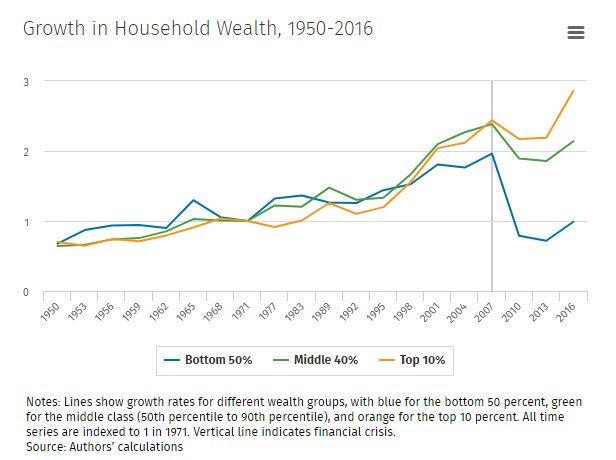
This gap between the share of equities owned by the top 1% and the bottom 90% is nearing its widest in 30 years alongside the record long economic expansion. And here an amazing admission by Goldman which crushes any argument the Fed may have to continue engaging in QE and monetary easing to “boost” the wealth of the middle class: “The equity share of the top 1% has generally been pro-cyclical during the past 30 years while the share for the bottom 90% has been counter-cyclical.”
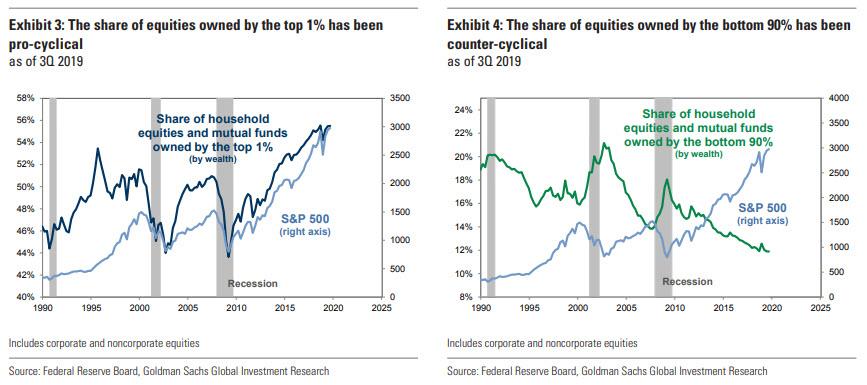
Of course, a less politically correct way of describing the above is “distribution”: the rich buy all the way up, then dump to gullible retail investors who load up on stocks… just as the recession begins.
This, in turn, brings us to the troubling punchline, one which explains precisely how the Fed has made the rich richer, while crushing the middle class: The top 1% has also been by far the main source of equity demand from households during the past 30 years. Since 1990, the top 1% has bought $1.2 trillion of equities and mutual funds compared with $1 trillion of net selling by the remaining 99%.
Some more observations on why the superrich vs the non-super rich have such a different purchasing pattern:
- Since 1990, starting equity allocations, US economic growth, and equity market returns have had a significant impact on equity demand from the wealthiest households. The top 1% has generally been a net buyer of equities when economic growth has been accelerating and stock prices have been rising. In contrast, equity demand from this cohort has been negatively correlated with equity allocations.
- Interest rates have been the most significant determinant of equity demand from the remaining 99% of households. Outside of the top 1%, households have typically increased their equity demand after the 10-year US Treasury yield falls. For the least wealthy households, rising stock prices and wage increases have also been drivers of equity purchases.
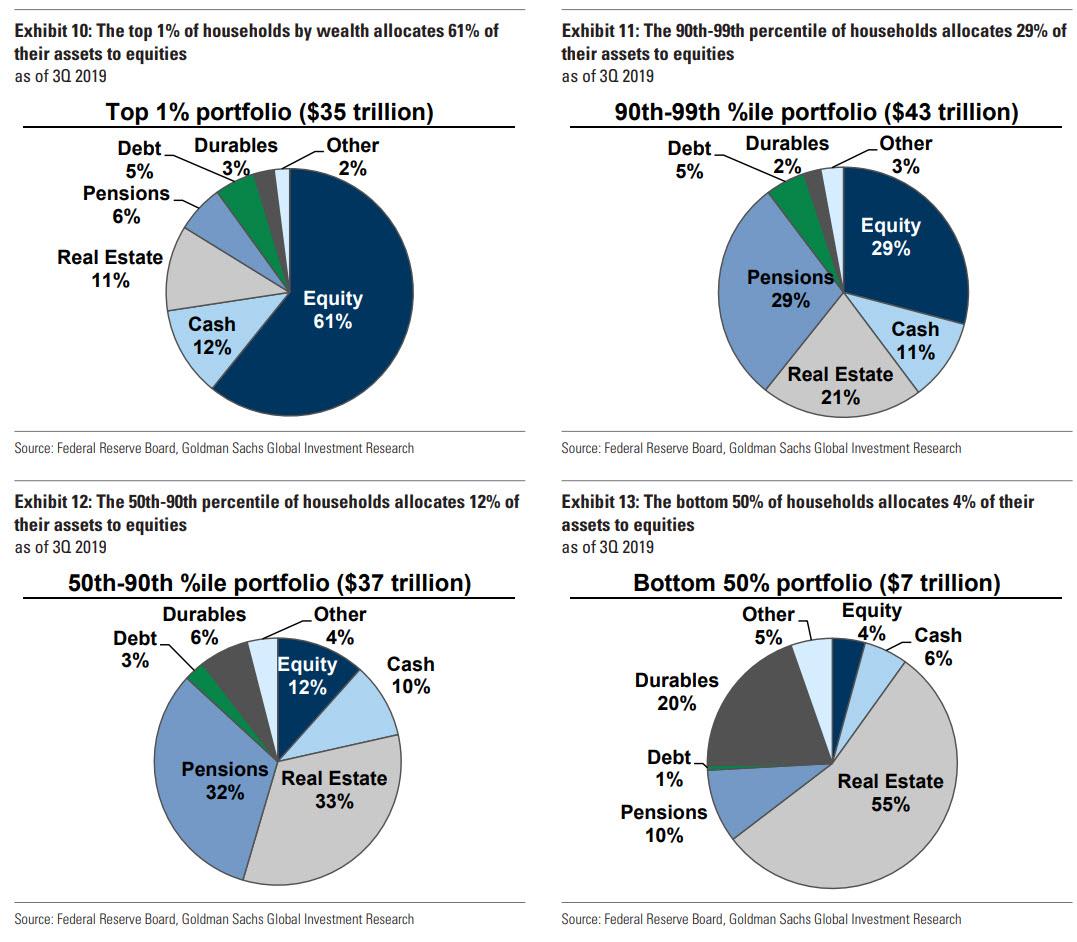
Portfolio allocations among the “bottom 99%” are less concentrated in equities than those among the top 1%, in absolute terms and relative to history. Equity allocation among the top 1% (61% of assets) is more than two times greater than the next 9% (29% of assets) and six times greater than the bottom 90% (10% of assets). The 90th-99th percentile of households allocates the majority of their assets to pension entitlements (29% of assets) while the next 40% and bottom 50% allocate most to real estate (Exhibits 10 to 13)
So what does this mean for market demand dynamics in 2020 and onward?
According to Goldman, while households will remain net buyers of equities this year, they will reduce their purchases relative to 2019. As we showed above, the wealthiest households have been by far the biggest driver of positive household equity demand. “Accelerating US economic growth and rising stock prices should continue to support equity purchases by the top 1%”, the Goldman strategists predict citing their economists who expect US GDP growth will accelerate from 2.1% to 2.5% (q/q ann.) between 4Q 2019 and 4Q 2020.
However, the equity allocation of the top 1% has risen near its all-time high, which will likely be a greater headwind to aggregate equity demand this year than in 2019. The top 1% allocates 61% of their total assets to equities ($21 trillion of $35 trillion), which ranks in the 97th percentile since 1990. Equity exposure at the start of 2019 stood at 58% (87th percentile). In contrast, this cohort’s allocation to debt, which has been generally been inversely correlated with its equity allocation, is close to its lowest in 30 years.
Meanwhile, rising interest rates will likely weigh on equity demand from the remaining 99% of households. Goldman’s rates strategists’ expect the 10-year US Treasury yield will rise from 1.64% to 2.25% by year-end 2020 alongside faster economic growth and rising inflation expectations. Then again, Goldman’s sellside researchers have been notoriously terrible at getting anything right in the past decade, and if only looks at where the 10Y is trading now (1.5%), this will be another catastrophic prediction by Goldman.
Assuming Goldman gets it right, however, the reduced aggregate household equity demand combined with the previously observed sharp decline in corporate repurchases…
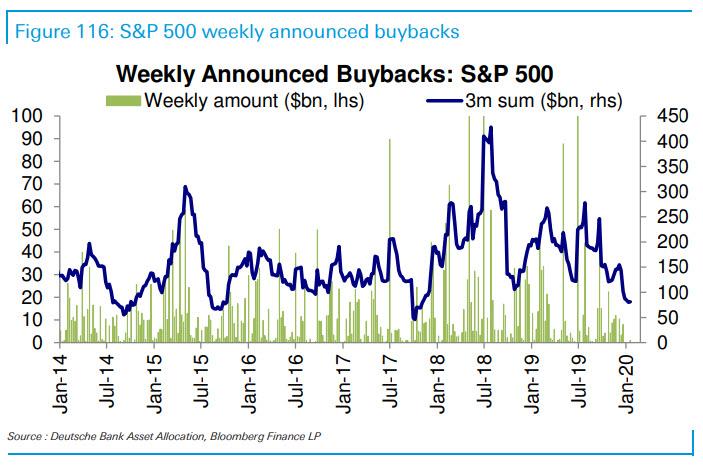
… suggests only modest potential upside to equity prices this year, according to the Goldman team. In addition, rising equity prices relative to bonds and outflows from mutual funds will likely drive pension fund and mutual fund selling this year, respectively.
Goldman’s conclusion is troubling: the bank now expects the S&P 500 will rise by only 4% to 3400 by year-end, a far cry from the nearly 30% increase in 2019:
Aggregate allocation to equities among households, mutual funds, pension funds, and foreign investors has risen to 46%, ranking in the 95th percentile since 1990. The fact that these four investor categories, which own almost 90% of the equity market, have limited potential to increase their equity allocations is consistent with our forecast of single-digit equity market returns this year.
There is, of course, a simple solution: the Fed turns activist, and in taking a page from the BOJ and SNB playbook, bypasses households entirely and starts buying stocks and ETFs in the open market. In fact, considering the tremendous success central banks have had in the past decade, this “final solution” to fair and efficient markets is only matter of when not if.
Tyler Durden
Thu, 01/30/2020 – 15:25
via ZeroHedge News https://ift.tt/2RDSTzp Tyler Durden